This page contains R code for conducting a Cheat or Honest investigation with a class. The class is split into groups, and each group is given status (unknown to the teacher) Cheat or Honest.
R is free statistical software available for Windows, UNIX, LINUX, and MacOS. Full information about R is here, or skip straight to download.
| Digit | Tally |
| 1 | 30 |
| 2 | 22 |
| 3 | 8 |
| 4 | 12 |
| 5 | 9 |
| 6 | 7 |
| 7 | 5 |
| 8 | 4 |
| 9 | 3 |
In R:
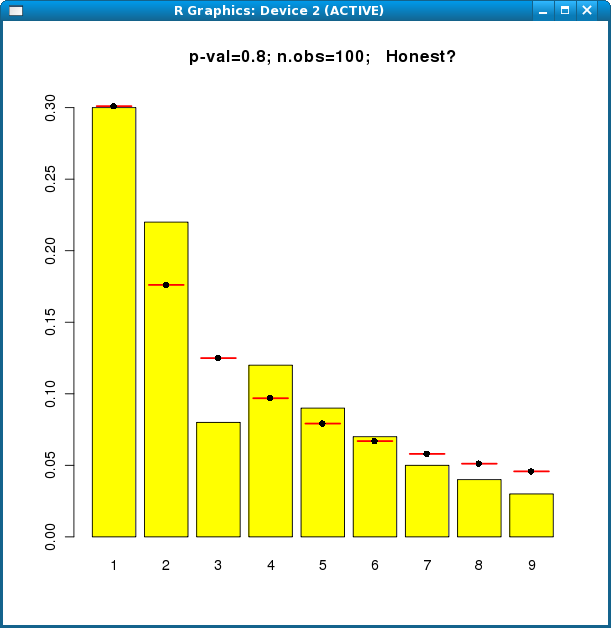
> fraud.func(c(30, 22, 8, 12, 9, 7, 5, 4, 3))
The bars show the digit frequencies in the data (30, 22, 8, etc). The horizontal red lines show the Benford frequencies. In the title to the picture, the code has guessed Honest or Cheat, based on a chi-squared test on all 9 categories. It will venture 'Honest' if the p-value is over 0.06. Unless the p-value is very small (< 0.01) it will keep a question-mark at the end, because we all know that p-values can be misleading.
If the sample size is less than 60, the code won't guess at all, but will just say "Warning, small sample size!"
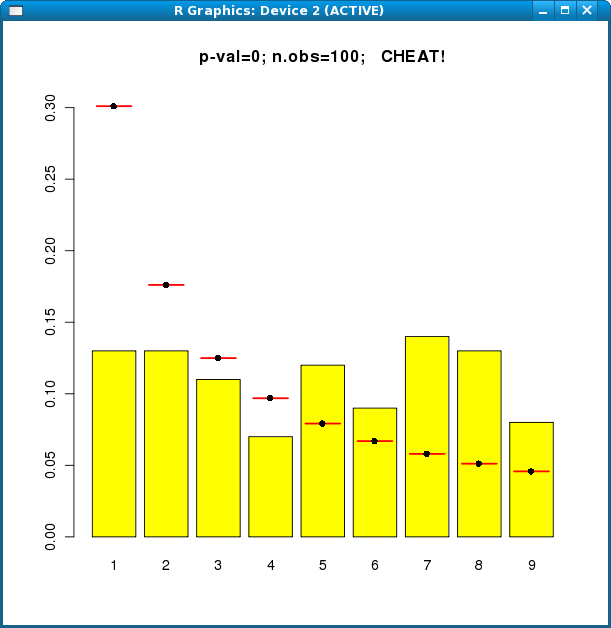
The next data set is from a Cheat group:
> fraud.func(c(13, 13, 11, 7, 12, 9, 14, 13, 8))
Two functions are built in to make it easy to generate either Honest data (truly Benford), or Cheat data (even distribution of digits). All you need to do is enter the number of observations:
For 120 "honest" observations:
> honest.func(120)
For 120 "cheat" observations:
> cheat.func(120)
With 120 observations, the cheating is so obvious that the code will get it right nearly every time. However, 6% of genuinely Honest runs will be wrongly branded "Cheat", by the definition of a p-value. (For 6% of genuine Honest runs, the p-value will be 0.06 or less.)
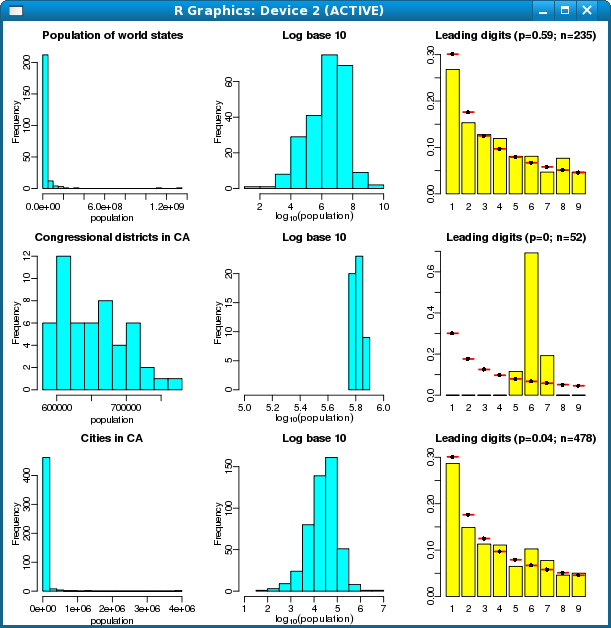
Finally, the R workspace also includes the functions and data sets used to generate Figure 2 in The American Statistician paper. (The Powerball data have been removed to respect the rights of the data provider, although you can get them yourself from Lottostrategies.com.)
In R:
> realdata.plot()
To see the list of data sets:
> ls()
Quit R with the following command:
> q()