Invader genetics for New Zealand conservation
We would like a map-linked graphical user interface (GUI) to enable fast, user-friendly
analysis of genetic data for conservation managers.
Start with a map:
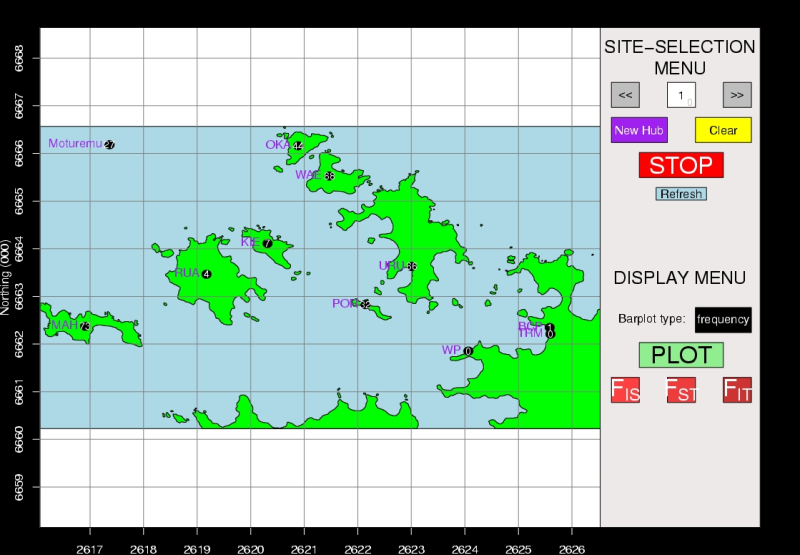
Select the populations you want to compare, and create genetic charts.
- Every point corresponds to one rat.
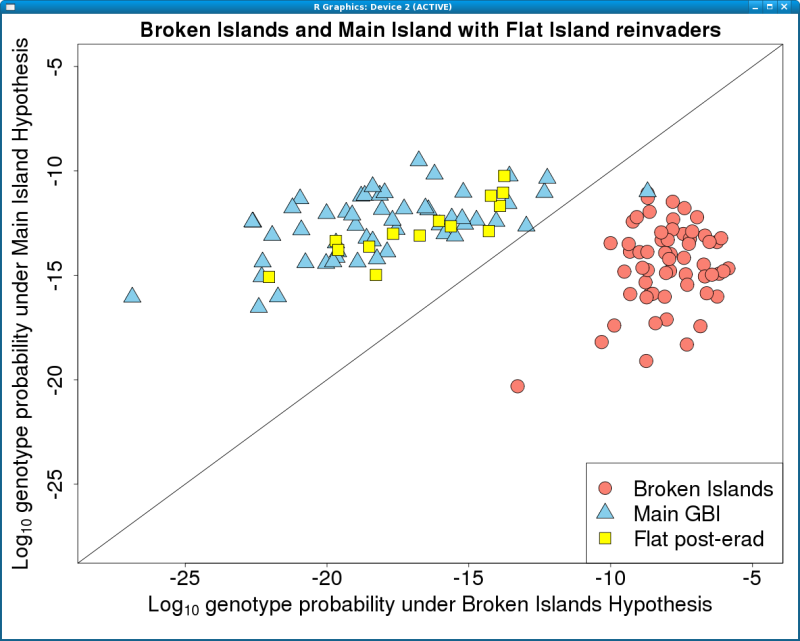
In the first case, the two possible source populations are very different (blue triangles
and red circles). The invader genetics (yellow squares) cluster strongly with the blue population.
-
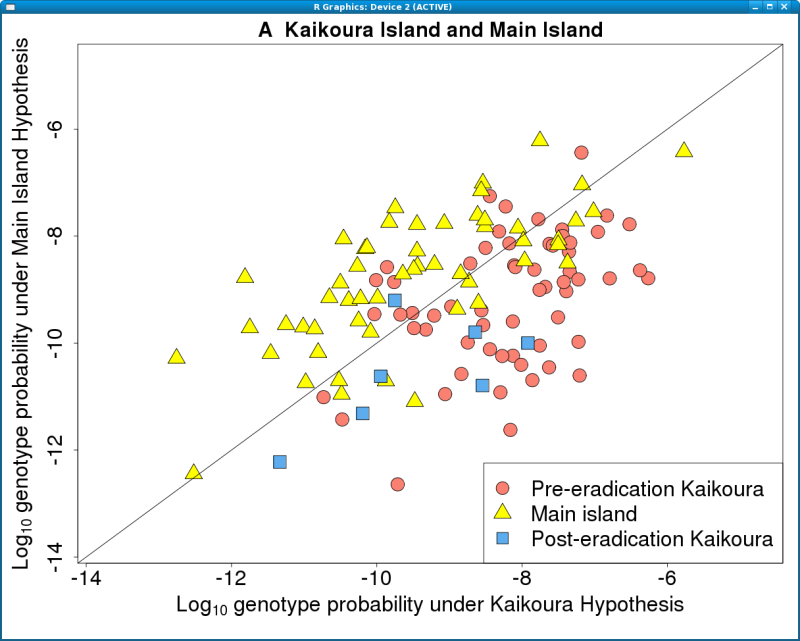
In the second case, the two source populations are very similar (yellow triangles
and red circles). The invader genetics (blue squares) are harder to assign.
Additional charts and animations
There are many additional charts and genetic computations we can include, including animations of
a population's genetic profile as it starts from scratch from a few invaders.
To find out more ...
- Powerpoint presentation on public display at the Russell Visitor Centre,
Bay of Islands, since 2007: here.
- Excerpts from powerpoint presentation about Aotea/Great Barrier Island,
2008: here.
- Call for multi-agency coordination: meeting outline for a meeting in
February 2010 with representatives from DoC, ARC, Landcare Research, Ecogene,
Auckland Museum, Pacific Invasives Initiative, and university researchers:
here.
- Rodent
Invasion Project: research group website.
- Introduction to genetics for island managers: in press for the Proceedings of the Islands Invasives Conference, 2011: here.
Rachel Fewster's home page