 |
It is important to mention spreadsheets as a storage option because spreadsheets are very widely used. However, it is also important to make a distinction between spreadsheet software, such as Microsoft Excel, and a spreadsheet format that is used to store a spreadsheet in computer memory, such as a Microsoft Excel workbook. Spreadsheet software can be a very useful tool for viewing and exploring data, but using a spreadsheet format as the primary storage format for a data set is often not the best option.
One problem with spreadsheet formats is that they are specific to a particular piece of software.
For many people, a spreadsheet means a Microsoft Excel workbook. Until recently, Excel workbooks used a proprietary binary format, which implied that the Microsoft Excel software was necessary to make use of an Excel workbook. In practice, the Excel binary format was decoded and implemented by a number of different projects and the specification of the Microsoft Excel binary format is now publicly available, so Excel spreadsheets, particularly simple spreadsheets that contain only data, can be opened by a number of different software programs.
The latest versions of Excel store workbooks in an XML-based format called Open Office XML (OOXML), which promises a greater potential for working with Excel spreadsheets using other software. However, there is considerable controversy over the format and, at the time of writing it is not clear whether Excel workbooks in this format will be useable with software other than Microsoft Office products.
Excel is by far the most common spreadsheet software, but many other spreadsheet programs exist, notably the Open Office Calc software, which is an open source alternative and stores spreadsheets in an XML-based open standard format called Open Document Format (ODF). This allows the data to be accessed by a wider variety of software.
However, even ODF is not ideal as a storage format for a research data set because spreadsheet formats contain not only the data that is stored in the spreadsheet, but also information about how to display the data, such as fonts and colors, borders and shading.
Another problem with storing a data set in a spreadsheet is that a lot of unnecessary additional information is stored in the file. For example, information about the borders and shading of cells is also stored in a spreadsheet file. The spreadsheet may also include formulas to calculate cell values, images (charts), and more. Storing a data set in a Microsoft Excel workbook format is almost as bad as writing computer code using Microsoft Word (see Section 2.4.1).
In these ways, a spreadsheet format is less appropriate than a plain text or binary data format because it contains information that is not relevant to the data set and because the data can only be accessed using specific software.
In some spreadsheet formats, there are also limits on the numbers of columns and rows, so very large data sets simply cannot be accommodated.
Spreadsheet software is useful because it displays a data set in a nice rectangular grid of cells. The arrangement of cells into distinct columns shares the same benefits as fixed-width format text files: it makes it very easy for a human to view and navigate within the data.
Most spreadsheet software also offers useful standard tools for manipulating the data. For example, it is easy to sort the data by a particular column. It is also possible to enter formulas into the cells of a spreadsheet so that, for example, sums and averages of columns may be obtained easily. In Excel, pivot tables (complex, interactive cross-tabulations) are a popular tool.
However, because most spreadsheet software provides facilities to import a data set from a wide variety of formats, these benefits of the spreadsheet software can be enjoyed without having to suffer the negatives of using a spreadsheet format for data storage. For example, it is possible to store the data set in a CSV format and use spreadsheet software to view or explore the data.
Furthermore, while spreadsheet software is very powerful and flexible, it is also quite lenient; it imposes very little discipline on the user. This tends to make it easy to introduce errors into a spreadsheet. We will see a more rigorous approach that provides powerful data manipulations in Section 5.6 on relational databases.
Finally, data exploration in spreadsheet software is typically conducted via menus and dialog boxes, which leaves no record of the steps taken. In chapter 9, we will look at writing computer code to explore data sets instead.
A study conducted by researchers from the Psychology Department at the University of Auckland5.3 looked at whether informative road signs had any effect on the speed at which vehicles travelled along a busy urban road in Auckland.
Data were collected for several days during a baseline period and for several days when each of five different signs were erected beside the road, for a total of six experimental stages. At each stage, the vehicle speeds were also collected for traffic travelling in the opposite direction along the road, to provide a set of “control” observations.
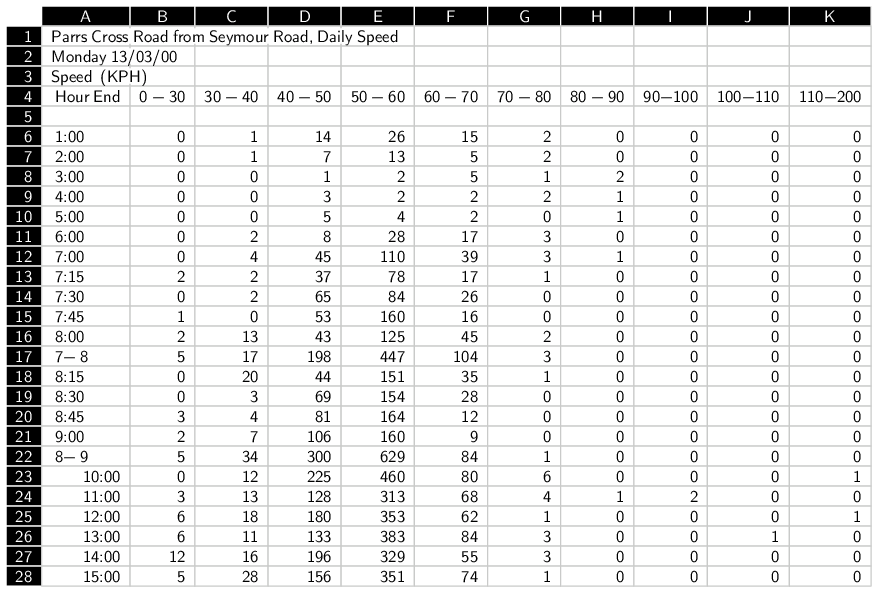
The data were collected by the Waitakere City Council via detectors buried in the road and were delivered to the researchers in the form of Excel spreadsheets. Figure 5.11 shows a section of one of these spreadsheets.
As we have discussed, spreadsheets are not an ideal data storage format, but this is an example where the researchers had no control over the format in which data are provided. This is why it is important to have some knowledge of a variety of data storage formats.
This figure demonstrates the fact that spreadsheet software displays the spreadsheet cells in a rectangular grid, which is very convenient for viewing the raw values in the data set. While it is not a replacement for proper data validation, taking a look at the raw values within a data set is never a bad thing.
Figure 5.11 also shows that it is straightforward to include metadata in a spreadsheet (cells A1 to A3) because each cell in the spreadsheet can contain any sort of value. On the other hand, just like in plain text formats, there is no way to indicate the special role of these cells; nothing in the file indicates where the real data begin.
Spreadsheets inherently provide a rows-and-columns view of the data, which, as we saw with plain text files, is not the most efficient way to represent data with a hierarchical structure.
In this case, the rows of the spreadsheet represent different times of the day and the columns represent different speed ranges. The actual data values are counts of the number of vehicles travelling within each speed range, within each time period. The spreadsheet shown in Figure 5.11 represents data from a single day of the study on one side of the road. How are the data for other days and data from the other side of the road stored?
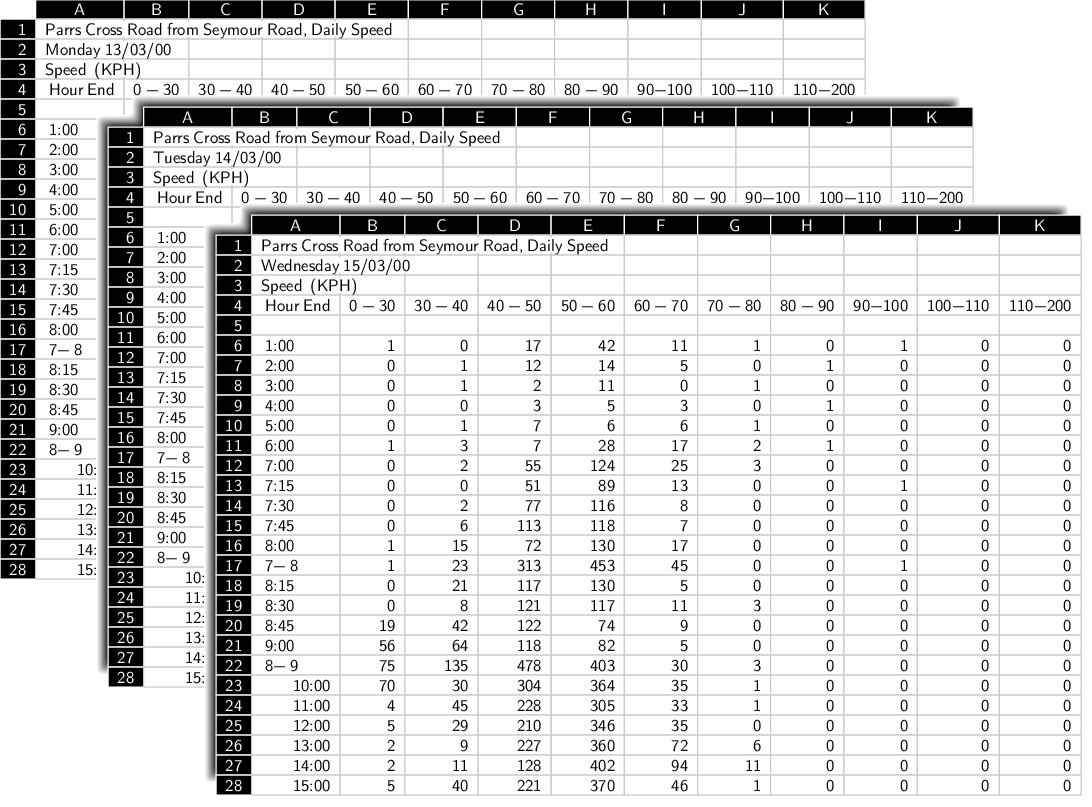
Another nice feature of most spreadsheet formats is that they allow for multiple sheets within a document. This effectively provides a 3-dimensional cube of data cells, rather than just a 2-dimensional table of cells. The vehicle speed study made use of this feature to store the data from each day on a separate sheet, so that all of the data from one stage of the experiment and on one side of the road are stored in a single spreadsheet.
Figure 5.12 shows three sheets, representing three days' worth of data, within one of the spreadsheet files.
However, each experimental stage of the study was stored in a separate spreadsheet file, for a total of 12 spreadsheets. Once a data set becomes split across multiple files like this, there are issues of ensuring that all files retain the same structure, and there are issues with expressing the relationships between the separate files. For example, how do we know which files relate to the same side of the road?
In this case, the names of the files can be used to differentiate between the side of the road and the experimental stage, but this naming scheme needs to be documented and explained somewhere. The problem is that there is no formal support for the person storing the data to express the structure of the data set. We will see better ways to resolve this problem in the next section on relational databases.
 |
Another important problem is that spreadsheet cells are able to act independently of each other. Although the data in Figure 5.11 appear to have a useful structure, with each data value clearly associated with a time period and a speed range, this is in fact an illusion. The spreadsheet software does not, by default, place any significance on the fact that the values in row 6 all correspond to the time period from midnight to 1:00 a.m. Every cell in the spreadsheet is free to take any value regardless of which row or column it resides in.
This problem can be seen by looking at the time values in column A. To the human observer, it is clear that this column of values (apart from the first three rows) corresponds to time intervals. However, the spreadsheet data model does not enforce any such constraint on the data, as the value in row 17 clearly shows. All of the values up to that point (rows 6 through 16) have been time values, but row 17 contains the value 7-8. To human eyes this is clearly the time period 7:00 a.m. to 8:00 a.m., but any software trying to read this column of values will almost certainly fail to make that intuitive leap.
This particular problem is a feature of this particular data set, but the general problem pertaining to all spreadsheets is that the flexible value-per-cell data model allows this sort of thing to happen and the consequence is that additional data cleaning is necessary before the raw data in the spreadsheet can be used for analysis.
It is a little unfair to point out these problems with a spreadsheet format example because most of these problems also exist for plain text files. The main point is that the spreadsheet format does not provide a great deal beyond much simpler format options and it introduces new problems of its own.
A spreadsheet storage format does allow for a 3-dimensional cube of data rather than just a 2-dimensional table of data, but it requires specific software and is less efficient because it stores extraneous information.
Paul Murrell

This work is licensed under a Creative Commons Attribution-Noncommercial-Share Alike 3.0 New Zealand License.