
Our starting point is the "tiger" example that comes with
GhostScript (in /usr/share/ghostscript/7.07/examples/
on my system).
A PNG version of the image is shown below (linked to a copy of
the original PostScript
version).
The goal is to import this image into R so that we can use it as part
of an R plot.
The first step is to export the PostScript file in a custom plain
text format. This is done by writing a new PostScript file that
redefines the stroke and fill
PostScript operators to write out
a path (rather than drawing it) and also to write out PostScript
graphics state information (such as line widths, colour, and so on).
The new script then runs the target PostScript file (in this case,
"tiger.ps") to produce a plain text file.
Here is an R function,
PStrace(), that will generate a new
PostScript file given a target PostScript file name and run the new
file using GhostScript (assumes your system has GhostScript installed).
The result
of the call PStrace("tiger.ps") is a plain text file
tiger.ps.out; the first few lines of that file are
show below (here is the whole file;
here is the new PostScript
file that was created to do the export).
move 72.0 0.0
line -0.0 0.0
line -0.0 72.0
line 72.0 72.0
close
fill 0.8 0.8 0.8 1.33
move 716.136 177.5
line 715.768 177.528
line 714.927 177.498
...
Having produced a plain text file, it is simple to read the plain text into R and convert it into whatever structure we like. Here is an R function,
PSimport(),
which reads the plain text file and creates a list of
PSobj objects. Each object has four slots:
two slots contain the x and y values for a path in the original image,
and two other slots contain the colour and line width for the path.
The class of the object describes whether it is a path to be stroked,
PSstroke, or filled, PSfill.
With the original PostScript paths converted to R objects, we can start
to play with them in R. The following R code imports the paths from
the plain text file tiger.ps.out and draws the tiger
using R grid graphics at the original size (a little bit of repositioning
with a viewport is
necessary for the image to be seen on a default device). The output
is almost identical to the original tiger image above (can't claim
it is exactly the same because we are not capturing things like
line joins and line endings yet).
paths <- PSimport("tiger.ps.out")
# Fill the fills and stroke the strokes
setGeneric("redo", function(x) { standardGeneric("redo") })
setMethod("redo", signature(x="PSstroke"),
          function(x) {
            grid.lines(x@x, x@y, default.units="points",
                       gp=gpar(lwd=x@lwd, col=x@rgb))
          })
setMethod("redo", signature(x="PSfill"),
          function(x) {
            grid.polygon(x@x, x@y, default.units="points",
                         gp=gpar(col=NA, fill=x@rgb))
          })
# reposition so output is visible
grid.newpage()
pushViewport(viewport(x=unit(-110, "points"),
                      y=unit(-300, "points"),
                      just=c("left", "bottom")))
invisible(lapply(paths, redo))
popViewport()
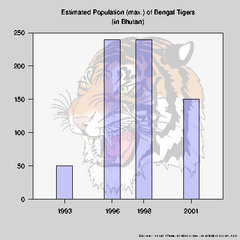
Here is a script which gets a bit fancier
(normalises the path locations and draw the tiger as a watermark
sort of image behind a barplot). A PNG version of the output
from this script is shown below (linked to a PDF version).
Problems and To Dos
pathforall,
the current PStrace() function is unlikely to cope properly
(may need to capture the current transformation matrix too?).
PStrace()
to allow control over flattening parameter when flatten
path.
PStrace()
to allow curvetos to be exported (i.e., don't flatten
path before pathforall), then draw curves in R as bezier cubic spline.
(Requires me to commit implementation of X-splines in R graphics
engine.)