One way to obtain a vector version of (at least simple) bitmap images is to draw them in an R window and then "trace" around the edges with mouse clicks.
Here is an R function, trace(),
which allows you to click in an R window; each click location
gets a point drawn and a line drawn from the previous click. Right
click to end. The grid argument allows you to control
the resolution of valid click locations.
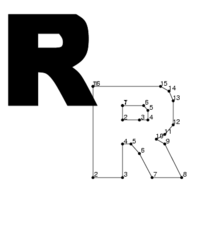
The following code uses this function to trace around the R in the R logo (PNG snapshot of window shown below code)
library(pixmap)
# load bitmap using pixmap
x <- read.pnm(system.file("pictures/logo.ppm", package="pixmap")[1])

# draw bitmap on screen
plot(x)

Routline <- trace(grid=0.02)
Rinside <- trace(grid=0.02)
# Redraw just the trace
grid.newpage()
grid.lines(Routline$x, Routline$y)
grid.lines(Rinside$x, Rinside$y)
# Resize, change line width, fill, ...
pushViewport(viewport(width=unit(1, "inches"),
                      height=unit(1, "inches")))
grid.polygon(Routline$x, Routline$y, gp=gpar(fill="black"))
grid.polygon(Rinside$x, Rinside$y, gp=gpar(fill="white"))
popViewport()

# Draw outline with numbers to ease editing
grid.newpage()
grid.lines(Routline$x, Routline$y)
grid.points(Routline$x, Routline$y, size=unit(2, "mm"), pch=16)
grid.text(1:unit.length(Routline$x),
          Routline$x + unit(2, "mm"),
          Routline$y + unit(2, "mm"))
grid.lines(Rinside$x, Rinside$y)
grid.points(Rinside$x, Rinside$y, size=unit(2, "mm"), pch=16)
grid.text(1:unit.length(Rinside$x),
          Rinside$x + unit(2, "mm"),
          Rinside$y + unit(2, "mm"))
There is work going on to provide X-splines as a drawing primitive in
R; this will allow you to smooth parts of the outline. (The shape
parameter is set to 0 at sharp corners and 1 at vertices to approximate;
the annotated outlines are used to decide which vertices to smooth.
PNG snapshot below code.)
# Draw as a spline (to smooth)
# Need to set some points as "sharp" corners
# (will not work even on r-devel at time of writing!)
pushViewport(viewport(x=.1, y=.8))
grid.xspline(Routline$x, Routline$y,
             shape=
             c(0, 0, 0, 0,
               1, 1, 0, 0,
               1, 0, 1, 1,
               1, 1, 0, 0),
             open=FALSE,
             gp=gpar(fill="black"))
grid.xspline(Rinside$x, Rinside$y,
             shape=
             c(0, 0, 0, 1,
               1, 0, 0),
             open=FALSE,
             gp=gpar(fill="white"))
popViewport()