Map-linked database under development by Sunil Patel.
Initial development by Sunil Patel and Rachit Bhatia under the Bestgrid Summer of e-Research scheme 2010-11.
See the database software demo below. Use Full-Screen mode to see what is happening.
Moving towards a genetic analysis engine:
Select the populations you want to compare, and create genetic charts.
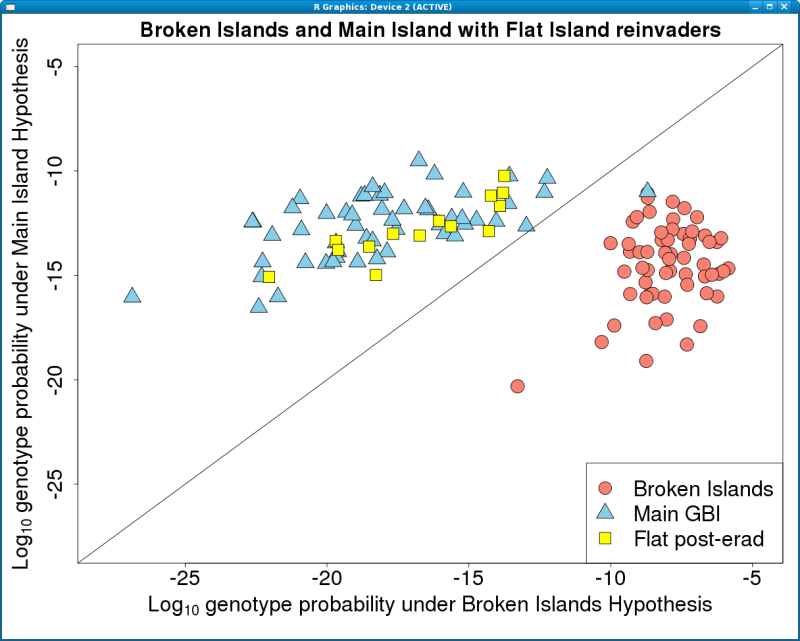
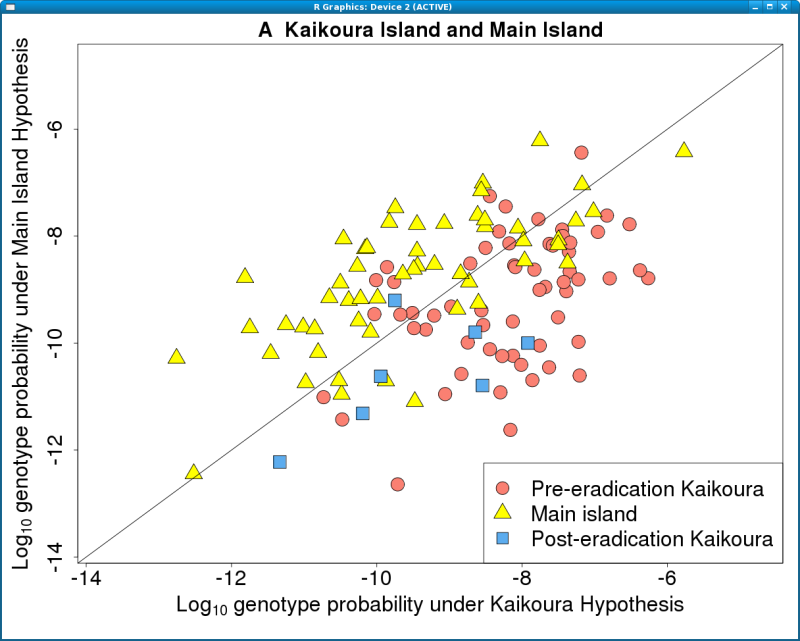
Every point corresponds to one rat.
In the first case, the two possible source populations are very different (blue triangles
and red circles). The invader genetics (yellow squares) cluster strongly with the blue population.
In the second case, the two source populations are very similar (yellow triangles
and red circles). The invader genetics (blue squares) are harder to assign.
Additional charts and animations
There are many additional charts and genetic computations we can include, including plots of trapping
success, hotspots, trends over time, and so on.
To find out more ...
Powerpoint presentation on public display at the Russell Visitor Centre,
Bay of Islands, since 2007: here.
Excerpts from powerpoint presentation about Aotea/Great Barrier Island,
2008: here.
Call for multi-agency coordination: meeting outline for a meeting in
February 2010 with representatives from DoC, ARC, Landcare Research, Ecogene,
Auckland Museum, Pacific Invasives Initiative, and university researchers:
here.