Output
> sp.plot("cb", 10, cb.bootind.119.10, 1, 6, 1, conf=0.95)
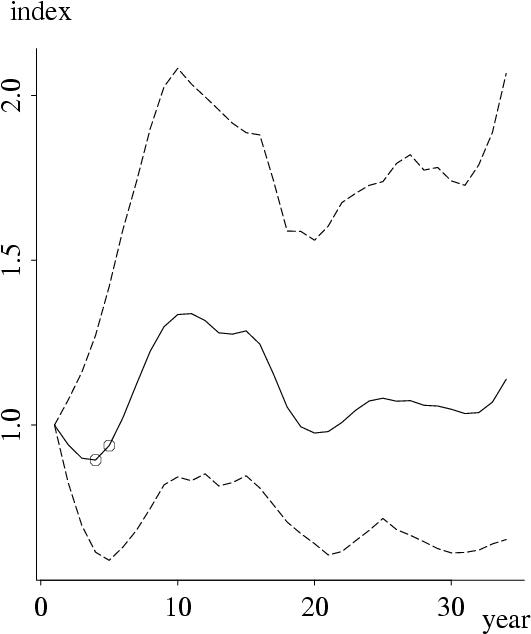
$upturns:
[1] 4 5
$downturns:
[1] "none"
Graphical Output