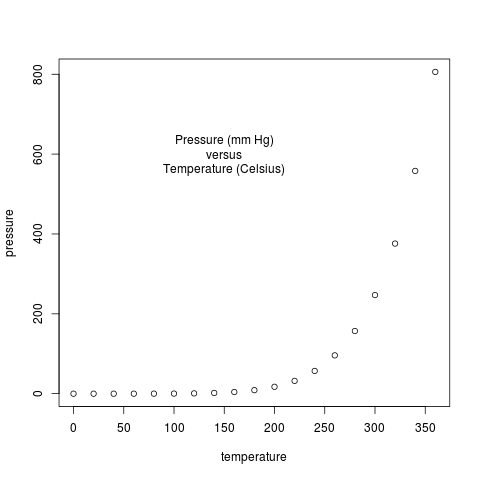
| Figure 1.1 |
| A simple scatterplot |

|
| R code |
|
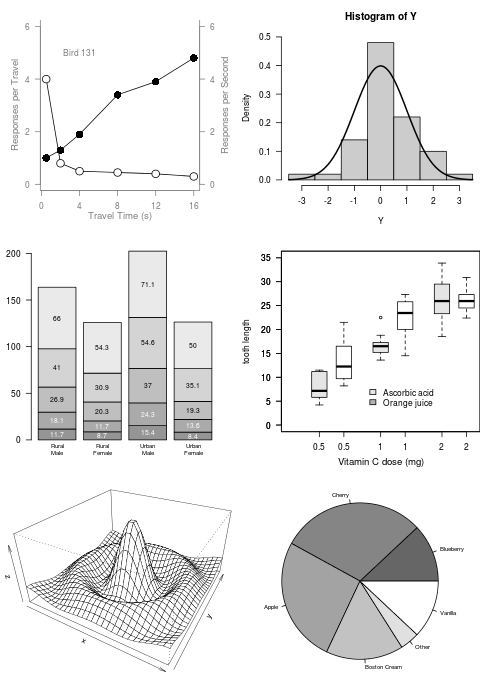
| Figure 1.2 |
| Some standard plots |

|
| R code |
|
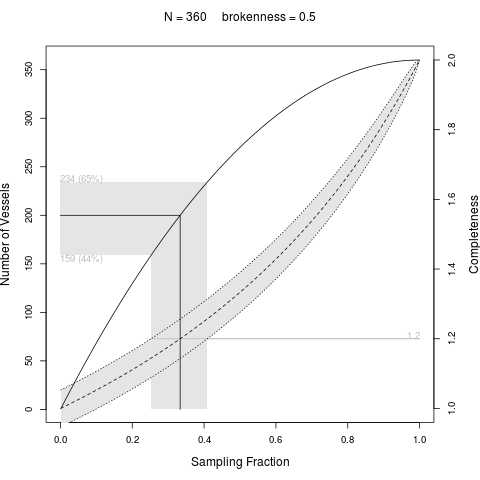
| Figure 1.3 |
| A customized scatterplot |

|
| R code |
|
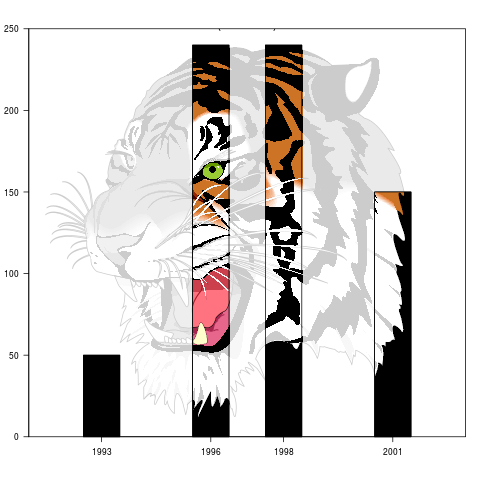
| Figure 1.4 |
| A dramatized barplot |

|
| R code |
|
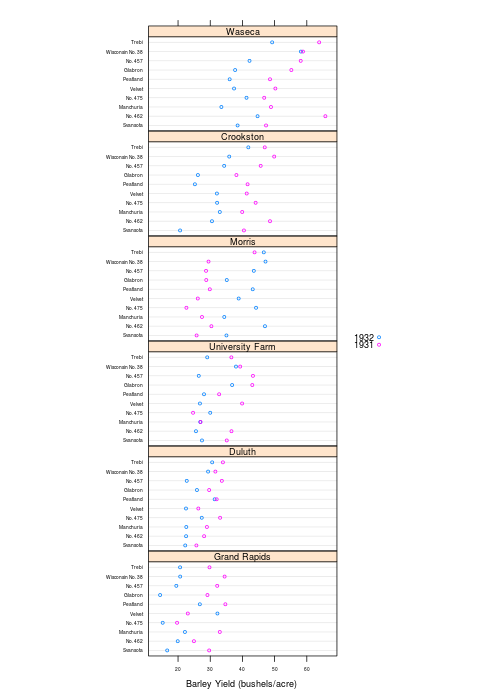
| Figure 1.5 |
| A Trellis dotplot |
|
| R code |
|
| Figure 1.6 |
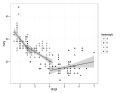
| A ggplot2 facetted scatterplot with smoother |
|
| R code |
|
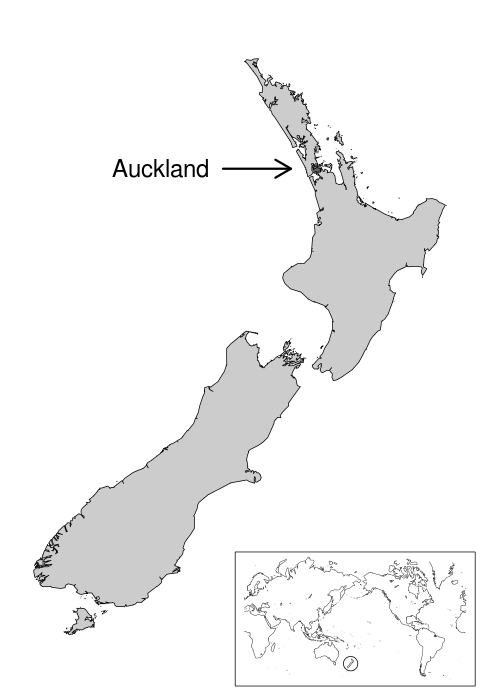
| Figure 1.7 |
| A map of New Zealand produced using R |

|
| R code |
|
| Figure 1.8 |
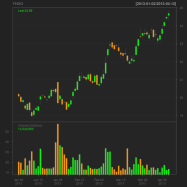
| A plot of financial data |
|
| R code |
|
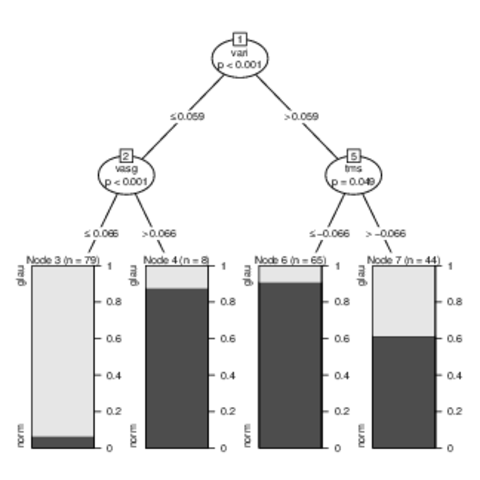
| Figure 1.9 |
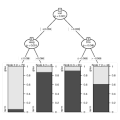
| A novel decision tree plot |
|
| R code |
|
| Figure 1.10 |
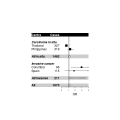
| A table-like plot |
|
| R code |
|
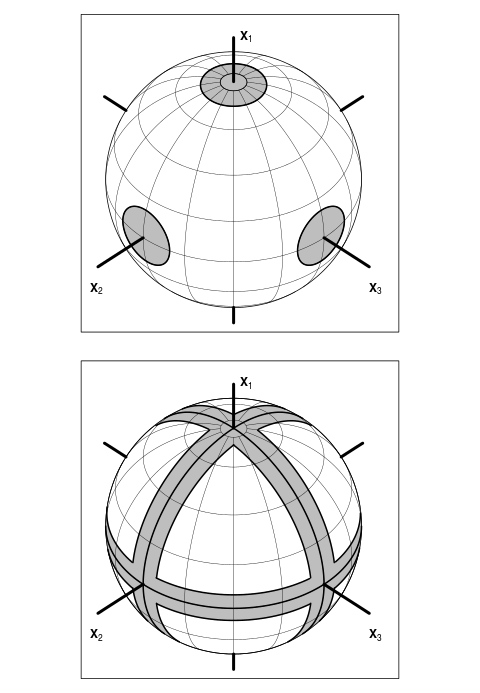
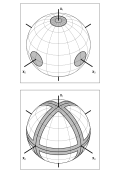
| Figure 1.11 |
| Didactic diagrams |
|
| R code |
|
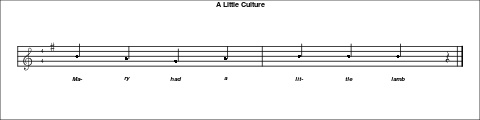
| Figure 1.12 |
| A music score |
|
| R code |
|
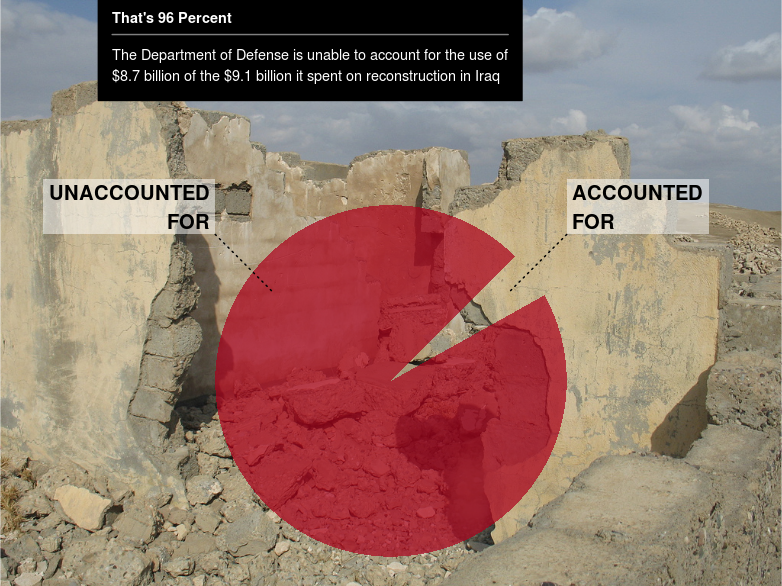
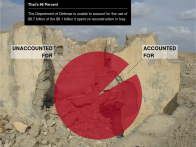
| Figure 1.13 |
| An infographic |
|
| R code |
|
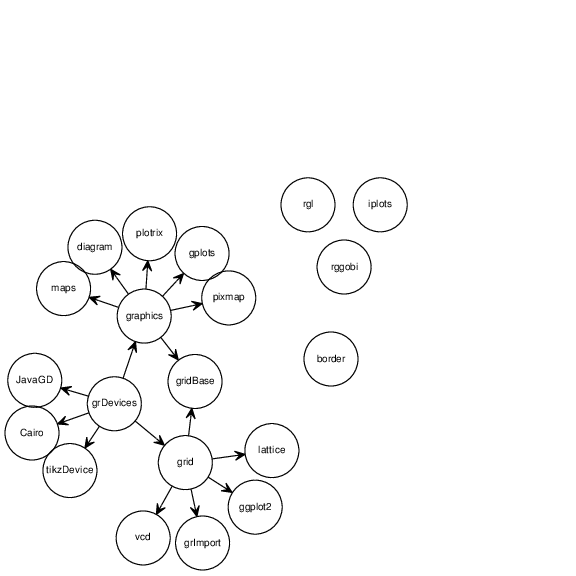
| Figure 1.14 |
| The structure of the R graphics system |

|
| R code |
|