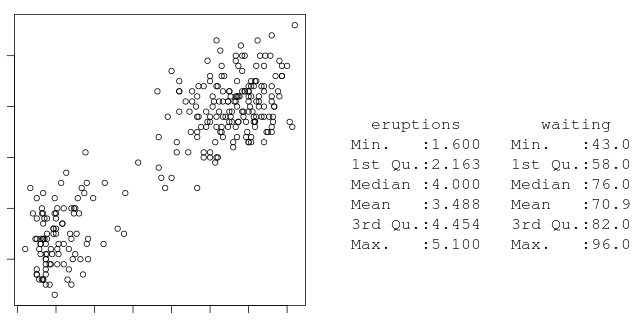
| Figure 11.1 |
| The textplot() function |
|
| R code |
|
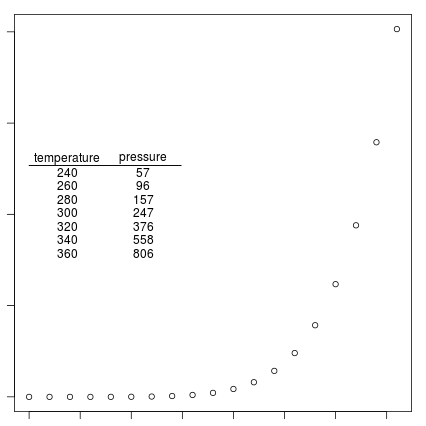
| Figure 11.2 |
| The addtable2plot() function |
|
| R code |
|
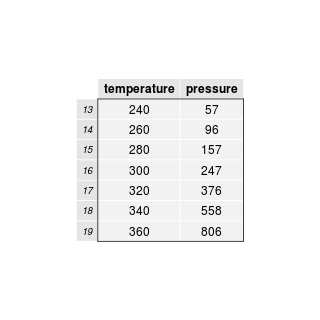
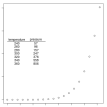
| Figure 11.3 |
| The grid.table() function |

|
| R code |
|
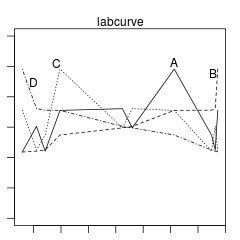
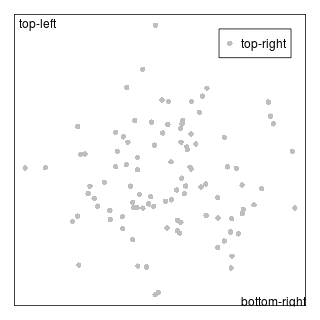
| Figure 11.4 |
| Finding empty space in a plot |

|
| R code |
|
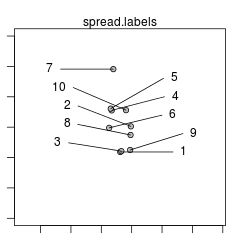
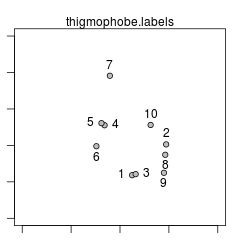
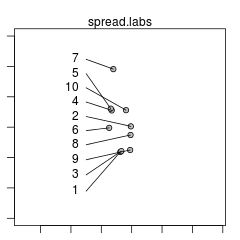
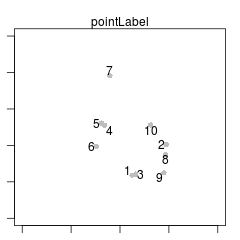
| Figure 11.5 |
| Drawing non-overlapping labels |


|
| R code |
|
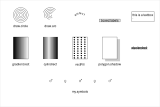
| Figure 11.6 |
| A menagerie of graphical primitives |
|
| R code |
|
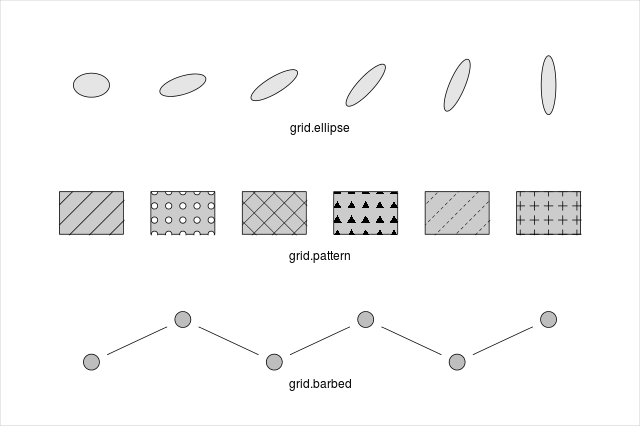
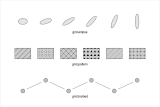
| Figure 11.7 |
| Some grid graphical primitives |
|
| R code |
|
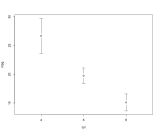
| Figure 11.8 |
| A scatterplot with error bars |
|
| R code |
|
| Figure 11.9 |
| Sequential and divergent grayscales |

|
| R code |
|
| Figure 11.10 |
| Coordinate system conversions |

|
| R code |
|
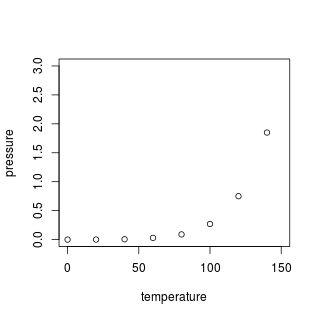
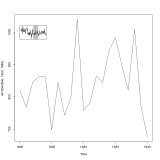
| Figure 11.11 |
| A plot within a plot |
|
| R code |
|
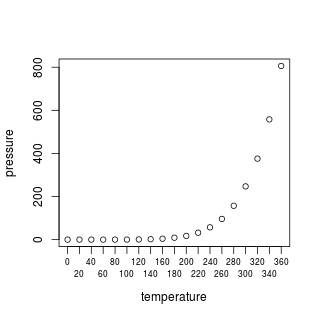
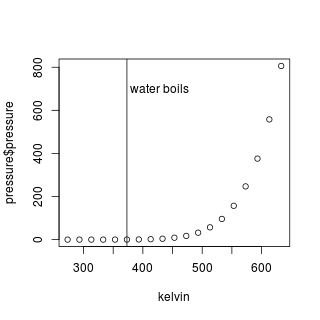
| Figure 11.12 |
| Axis annotations |


|
| R code |
|
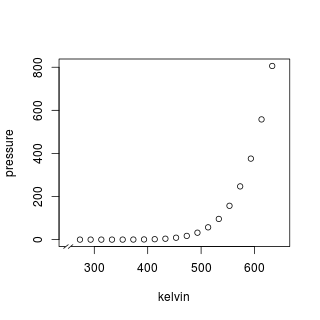
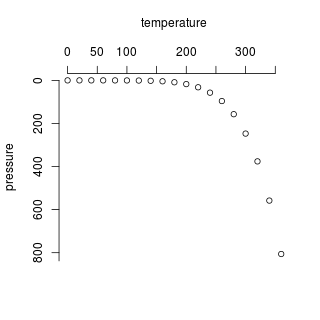
| Figure 11.13 |
| Modifying the axis scales |


|
| R code |
|