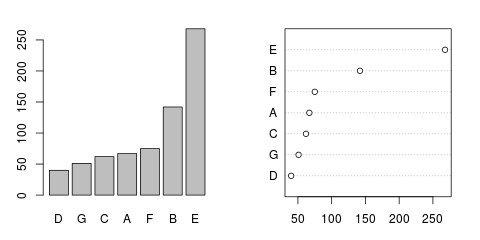
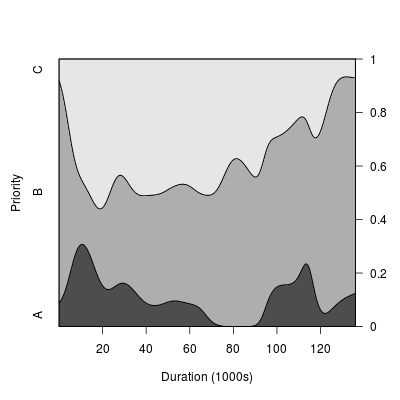
| Figure 13.1 |
| Plots of univariate categorical data |
|
| R code |
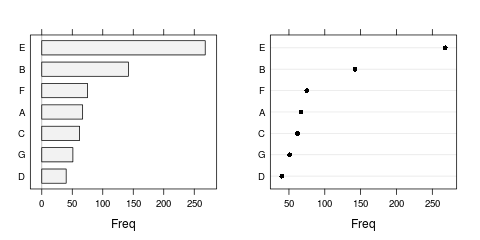
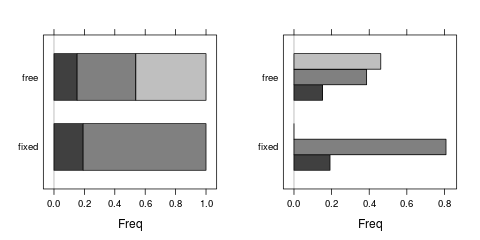
| Figure 13.2 |
| Categorical data as the dependent variable |
|
| R code |
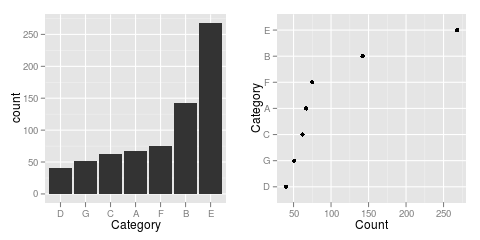
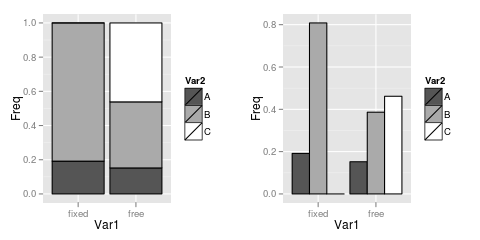
| Figure 13.3 |
| Barplots of two variables |
|
| R code |
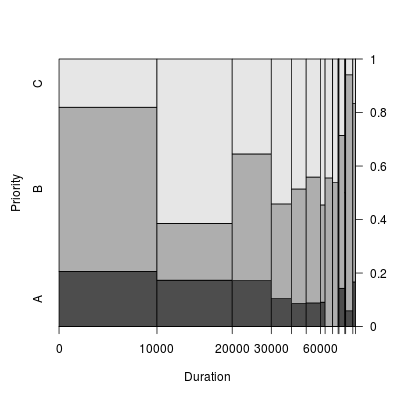
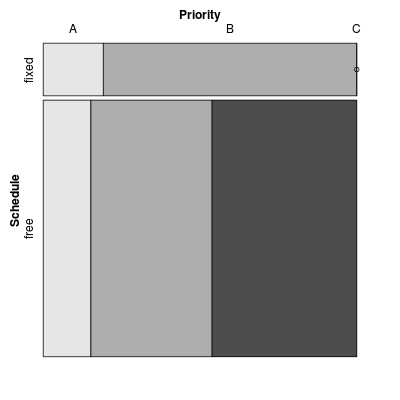
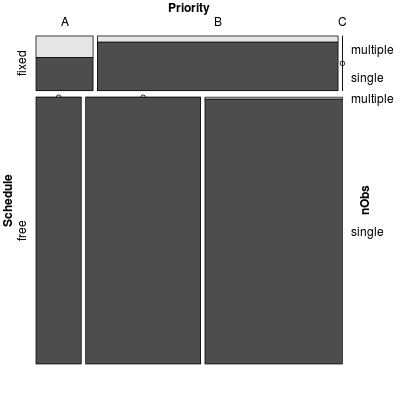
| Figure 13.4 |
| Mosaic plots |
|
| R code |
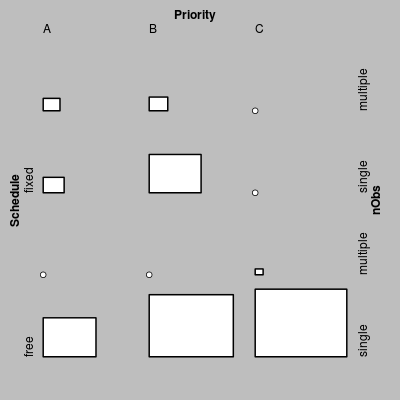
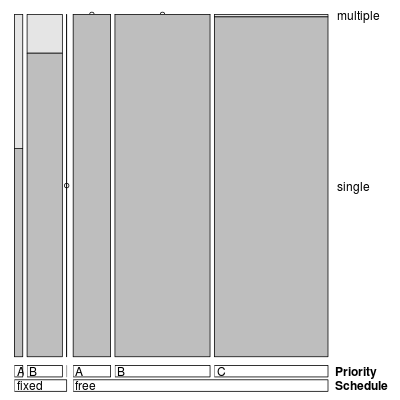
| Figure 13.5 |
| Tile displays and double-decker plots |
|
| R code |
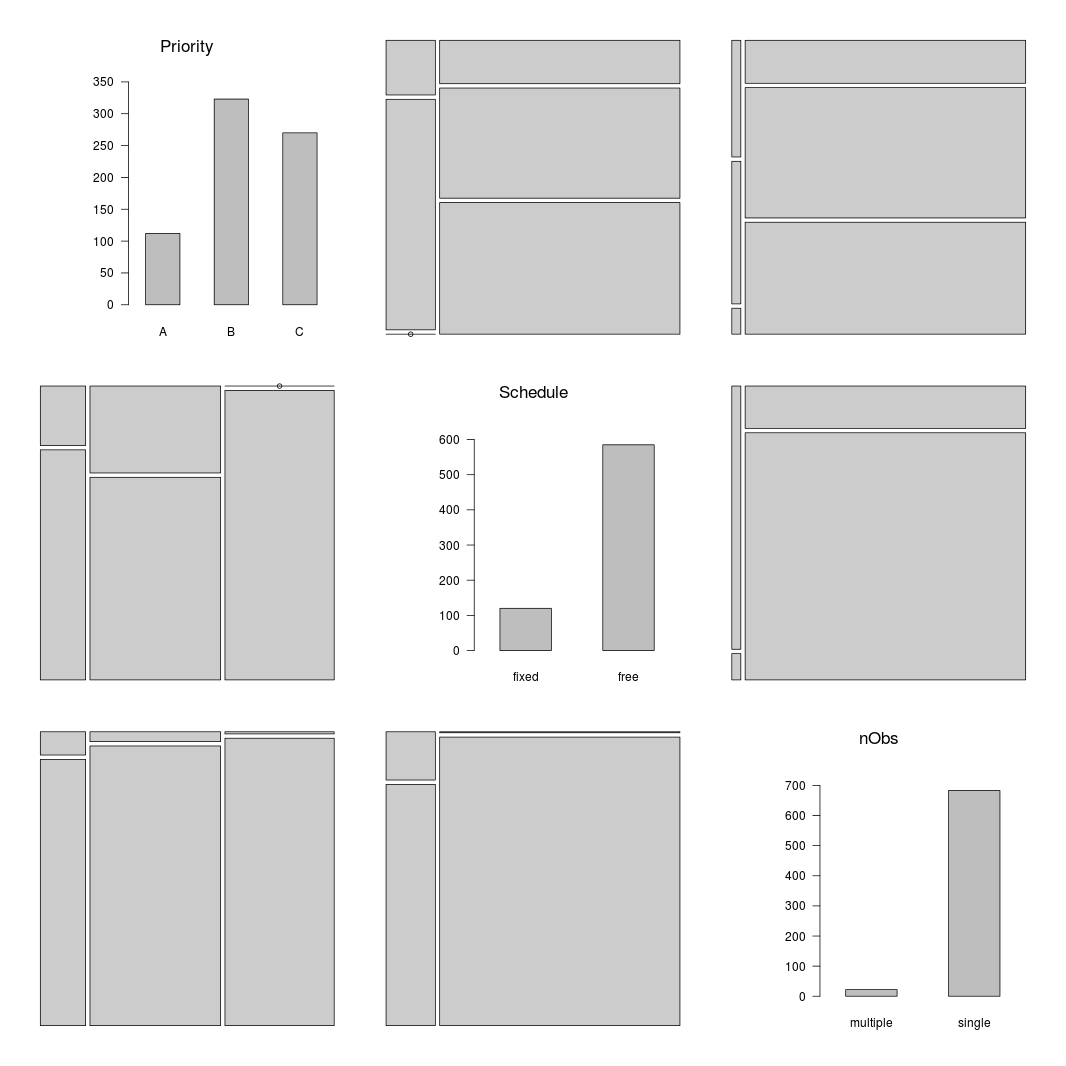
| Figure 13.6 |
| A categorical plot matrix |
|
| R code |
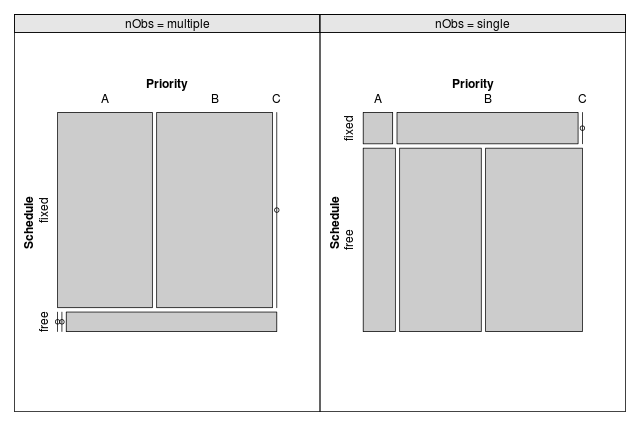
| Figure 13.7 |
| Multipanel conditioning mosaic plots |
|
| R code |
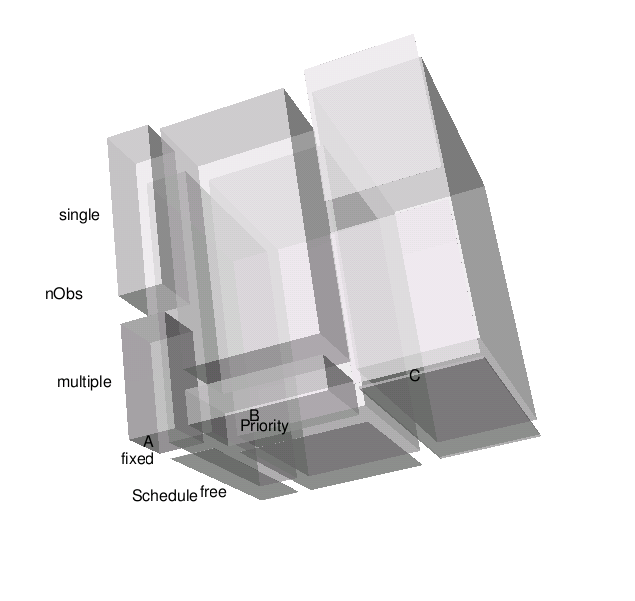
| Figure 13.8 |
| A 3D mosaic plot |
|
| R code |