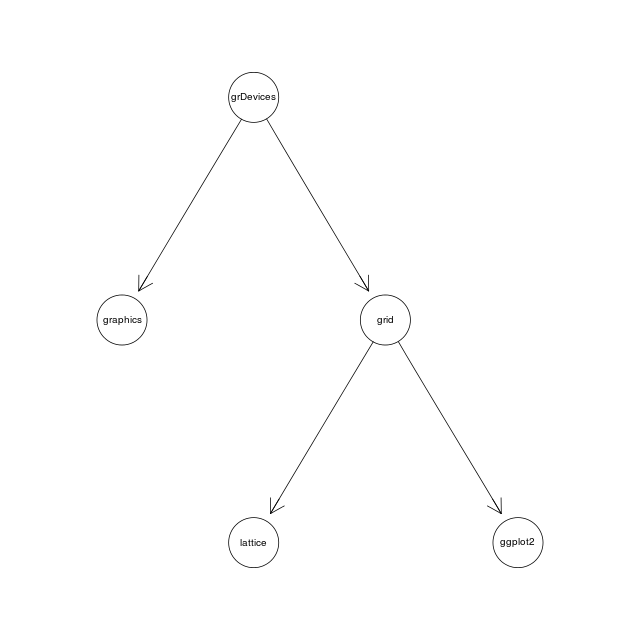
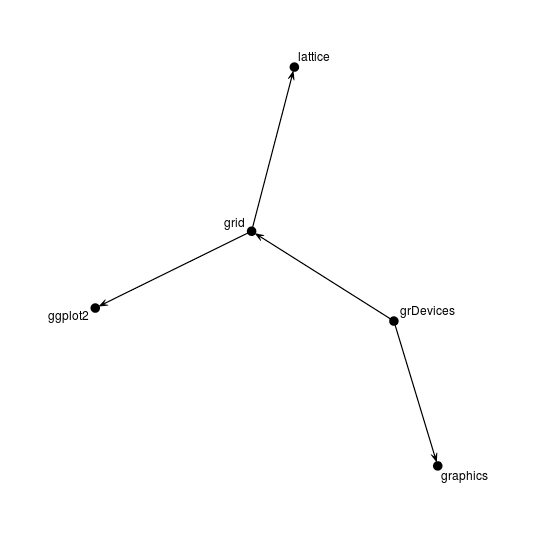
| Figure 15.1 |
| A simple node-and-edge graph |
|
| R code |
| Figure 15.2 |
| A simple GXL file |
| R code |
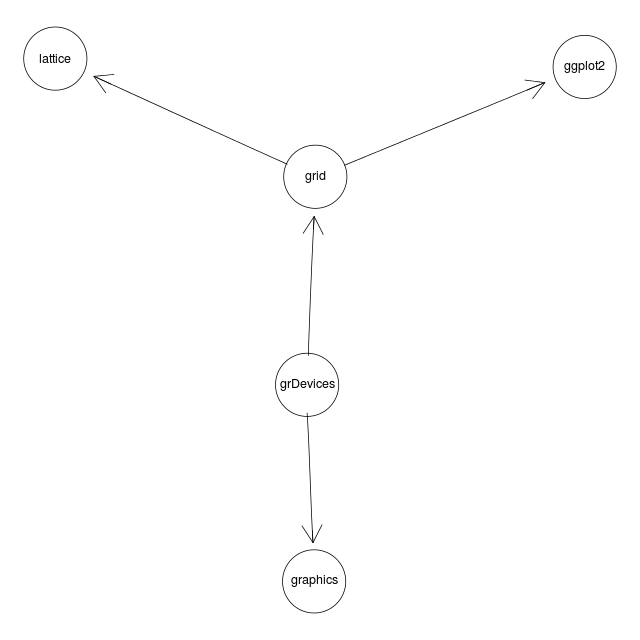
| Figure 15.3 |
| Rendering a graph with Rgraphviz |
|
| R code |
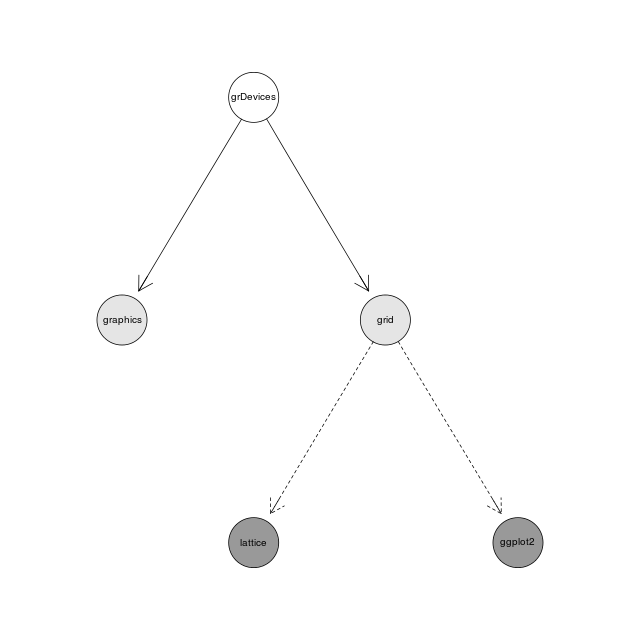
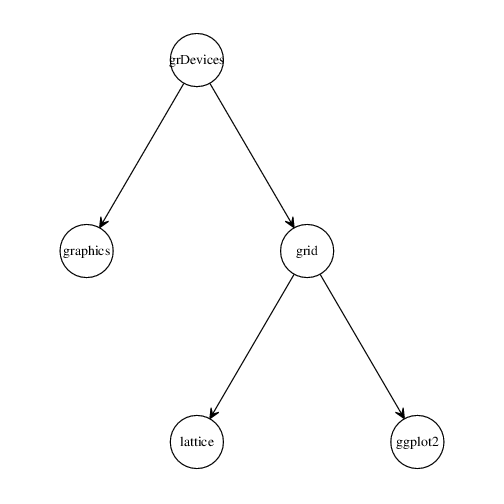
| Figure 15.4 |
| Modifying graph attributes |
|
| R code |
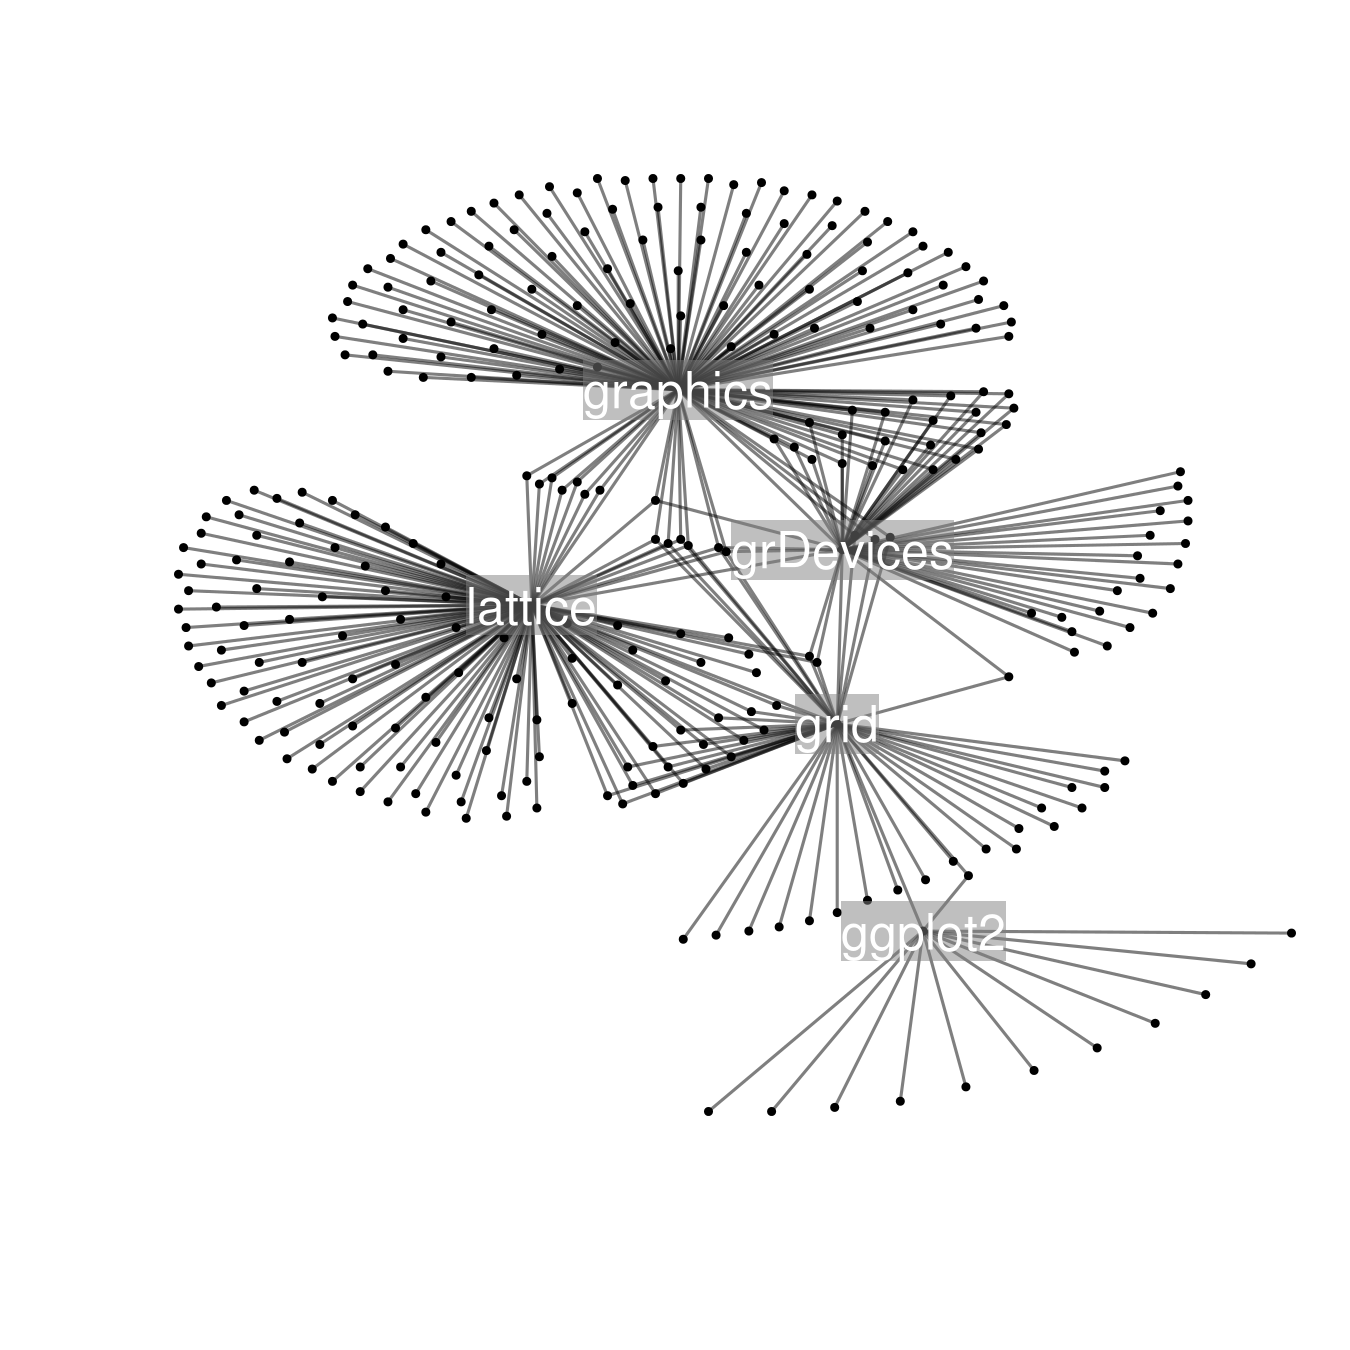
| Figure 15.5 |
| Customized graph rendering |
|
| R code |
| Figure 15.6 |
| Rendering with graphviz |
|
| R code |
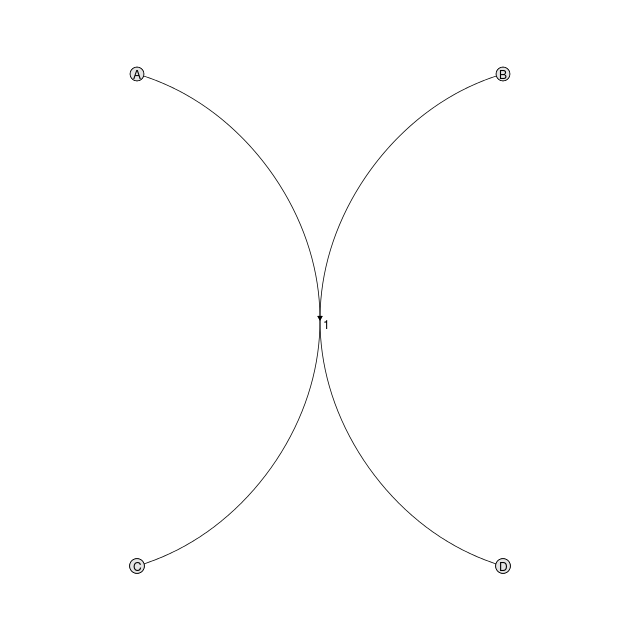
| Figure 15.7 |
| A simple hypergraph |
|
| R code |
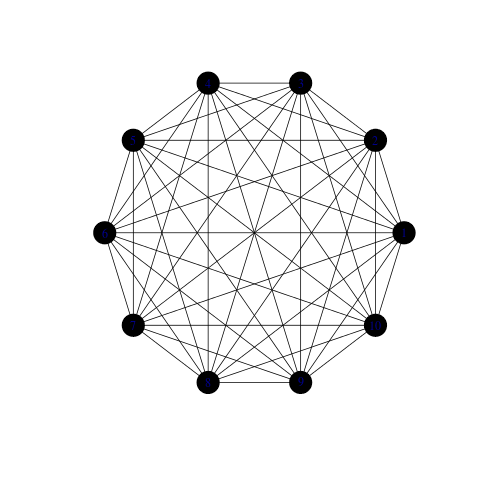
| Figure 15.8 |
| Some regular graphs |
|
| R code |
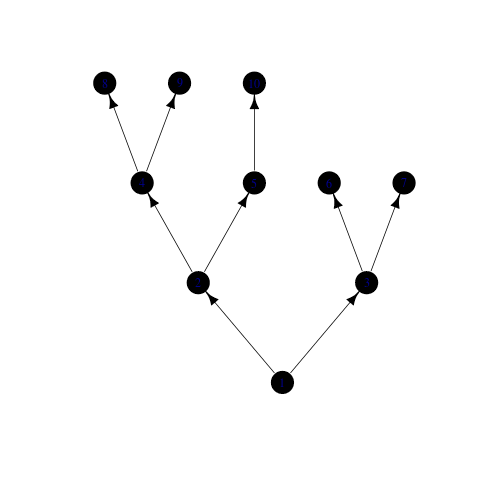
| Figure 15.9 |
| A simple network |
|
| R code |
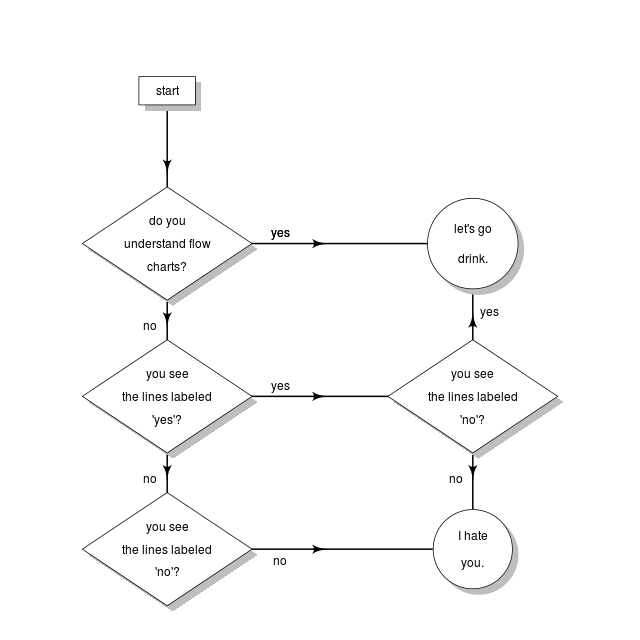
| Figure 15.10 |
| A flow chart |
|
| R code |