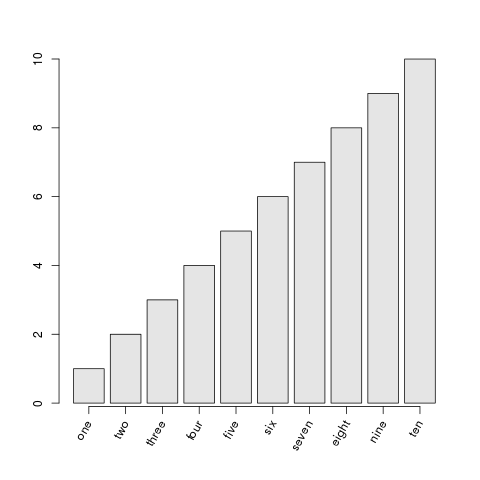
Figure 19.1
Annotating a traditional plot with grid
R code
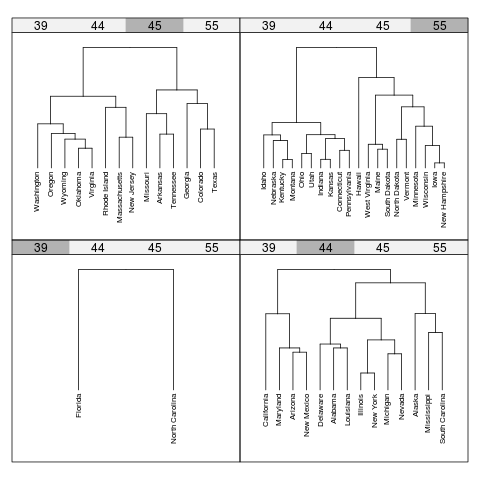
Figure 19.2
Embedding a traditional plot within lattice output
R code