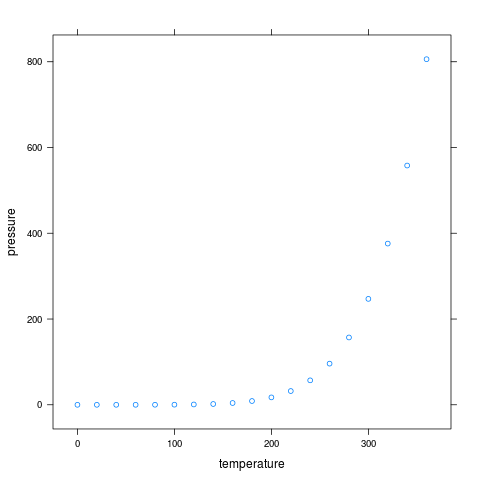
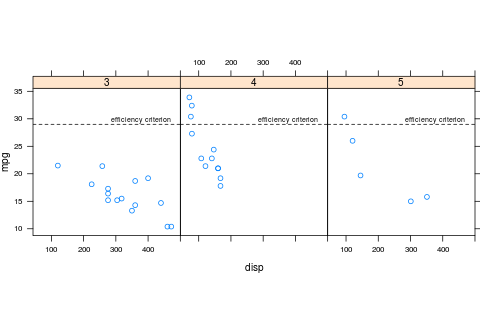
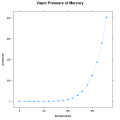
| Figure 4.1 |
| A scatterplot using lattice |
|
| R code |
|
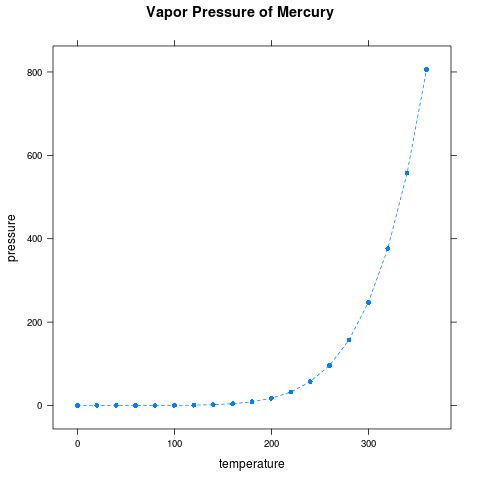
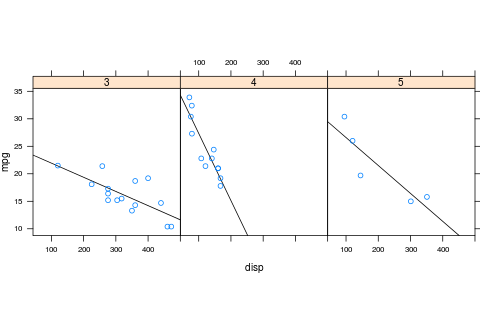
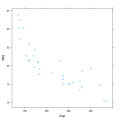
| Figure 4.2 |
| A modified scatterplot using lattice |
|
| R code |
|
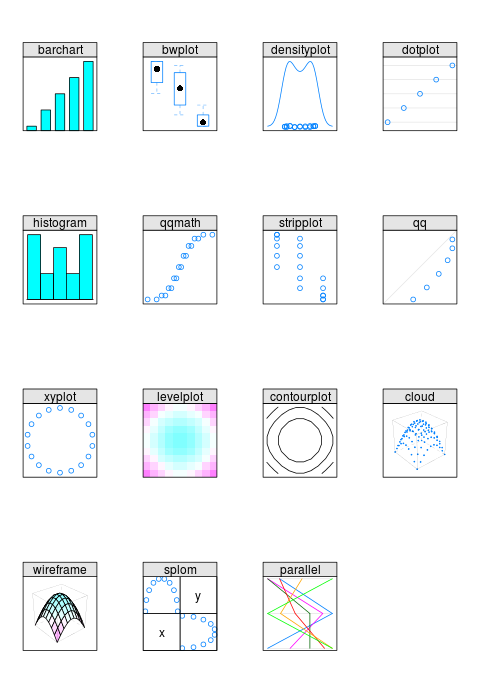
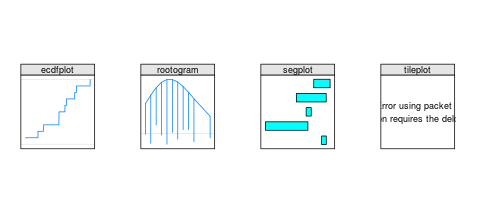
| Figure 4.3 |
| Plot types available in lattice |

|
| R code |
|
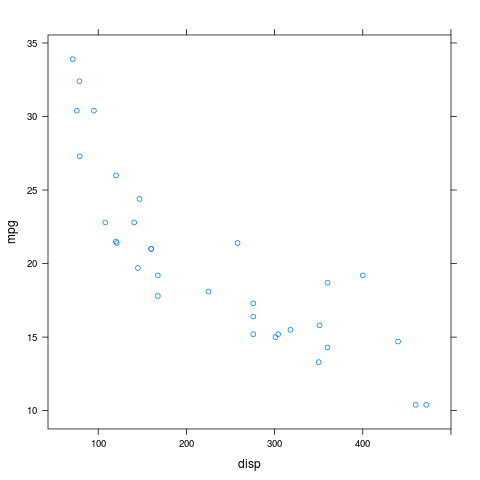
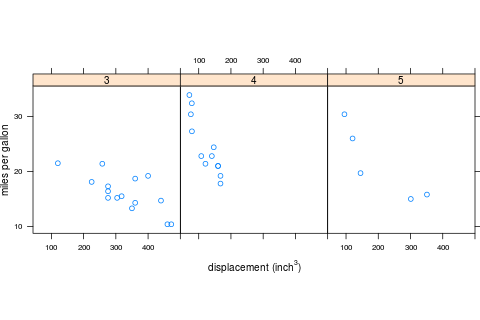
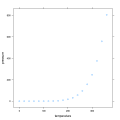
| Figure 4.4 |
| A lattice scatterplot |
|
| R code |
|
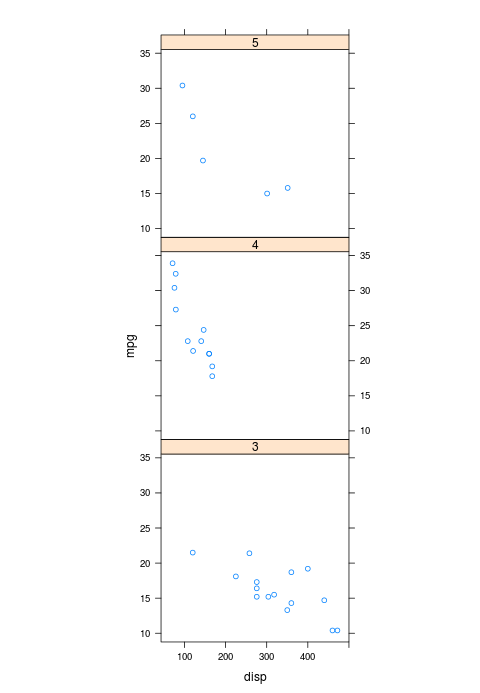
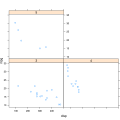
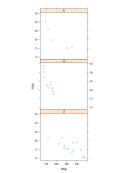
| Figure 4.5 |
| A lattice multipanel conditioning plot |
|
| R code |
|
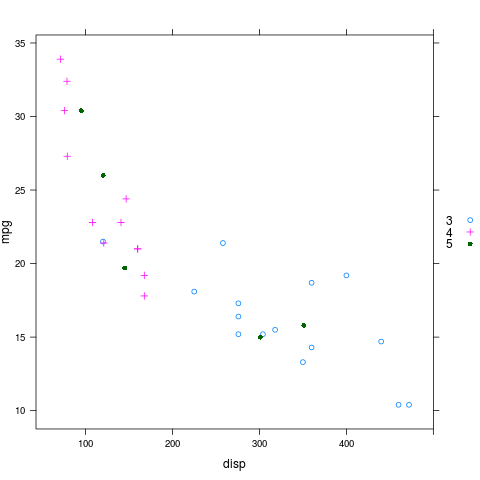
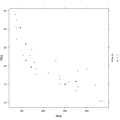
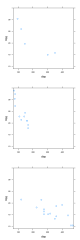
| Figure 4.6 |
| A lattice plot with multiple groups |
|
| R code |
|
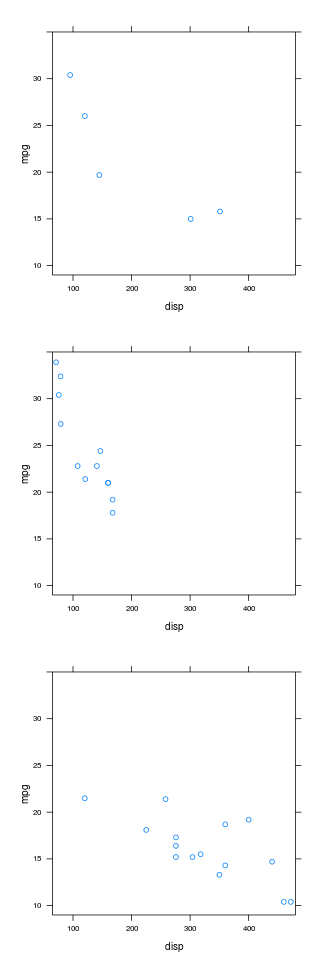
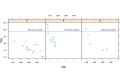
| Figure 4.7 |
| Controlling the layout of lattice panels |
|
| R code |
|
| Figure 4.8 |
| Arranging multiple lattice plots |
|
| R code |
|
| Figure 4.9 |
| Modifying lattice axes |

|
| R code |
|
| Figure 4.10 |
| Annotating lattice plots |
|
| R code |
|
| Figure 4.11 |
| A lattice panel function |
|
| R code |
|
| Figure 4.12 |
| Some default lattice settings |
|
| R code |
|
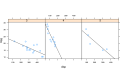
| Figure 4.13 |
| Plot types available in latticeExtra. |

|
| R code |
|