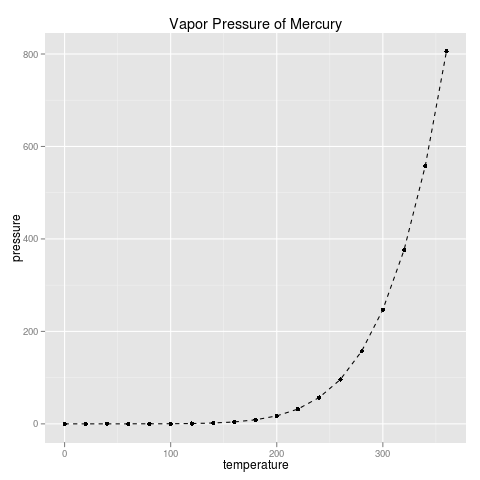
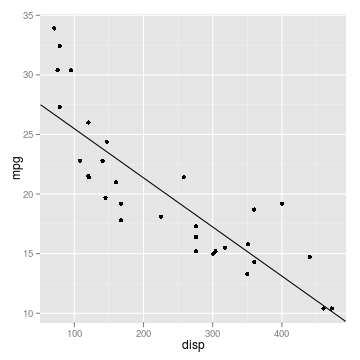
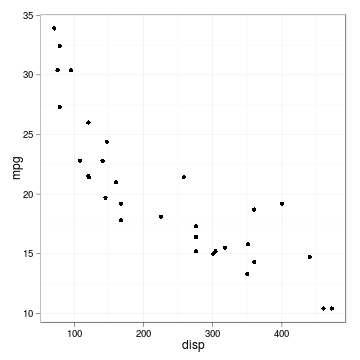
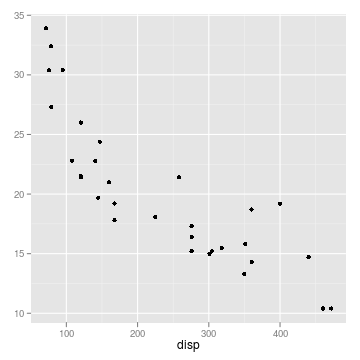
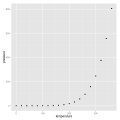
| Figure 5.1 |
| A scatterplot using qplot() |
|
| R code |
|
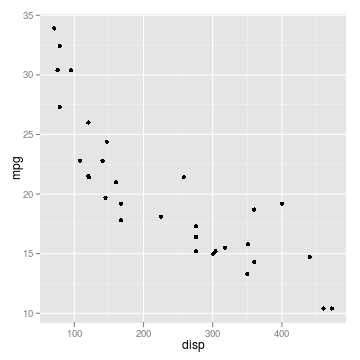
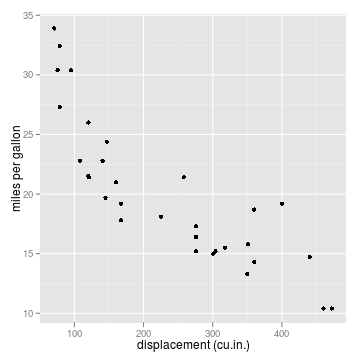
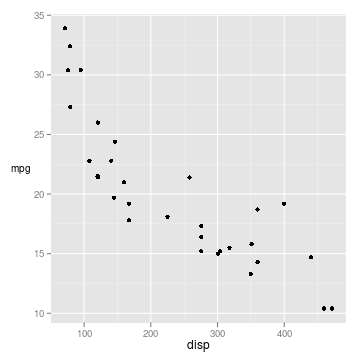
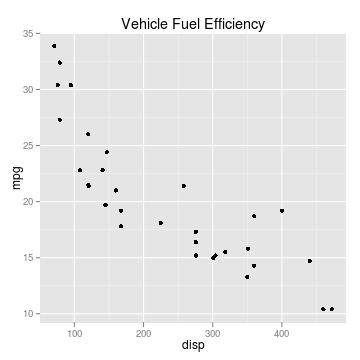
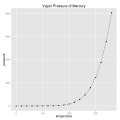
| Figure 5.2 |
| A modified scatterplot using qplot() |
|
| R code |
|
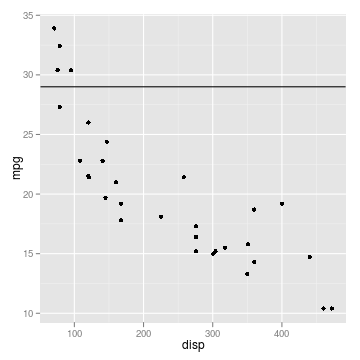
| Figure 5.3 |
| Core components in ggplot2 |

|
| R code |
|
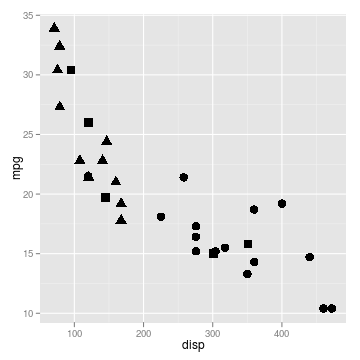
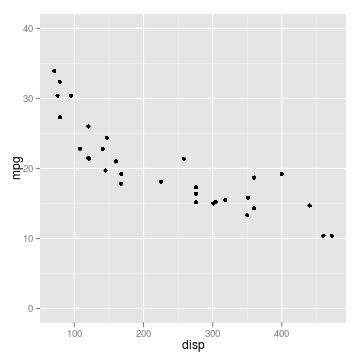
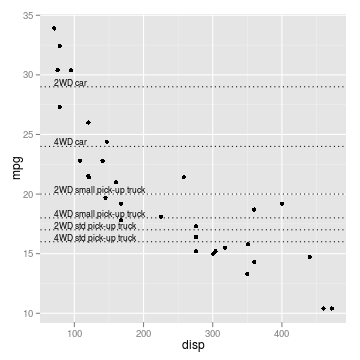
| Figure 5.4 |
| Examples of geoms and aesthetics |


|
| R code |
|
| Figure 5.5 |
| Examples of scales |


|
| R code |
|
| Figure 5.6 |
| Scale components in ggplot2 |

|
| R code |
|
| Figure 5.7 |
| Stat components in ggplot2 |

|
| R code |
|
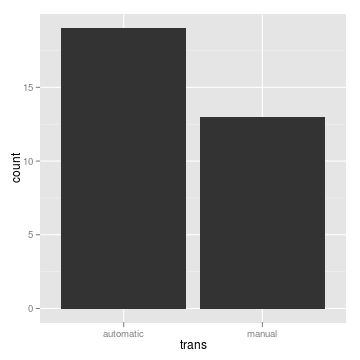
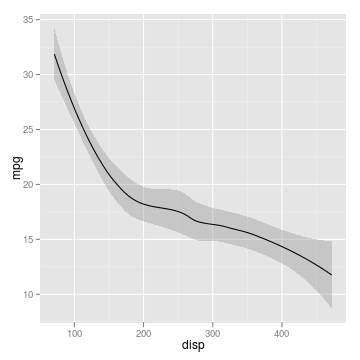
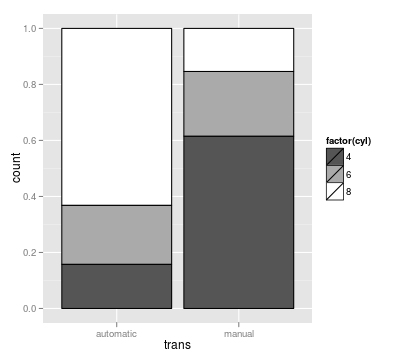
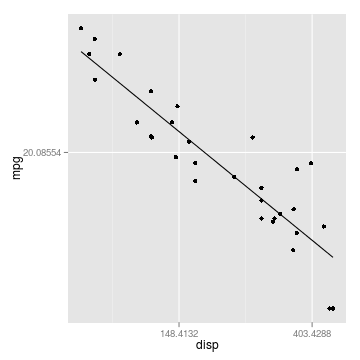
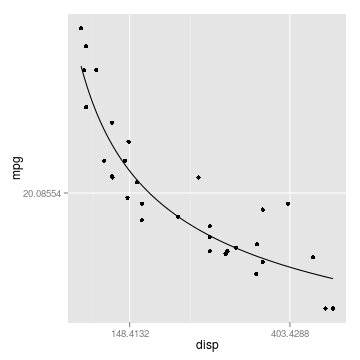
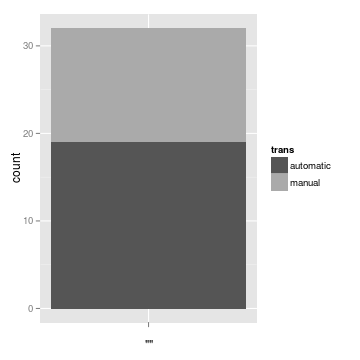
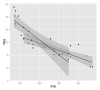
| Figure 5.8 |
| Examples of statistical transformations |


|
| R code |
|
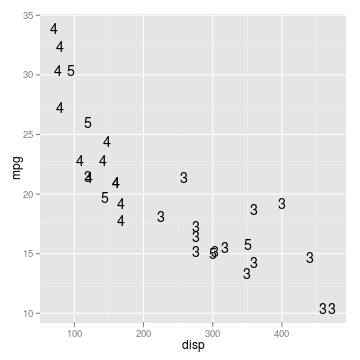
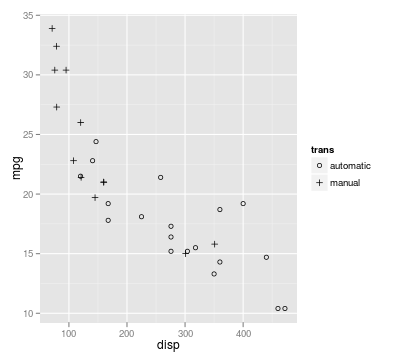
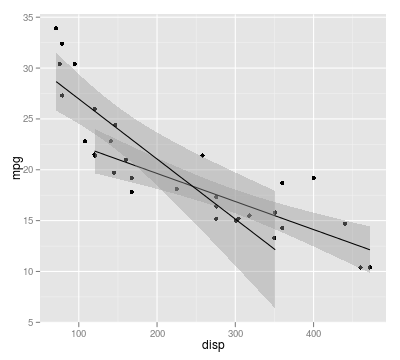
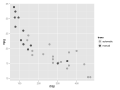
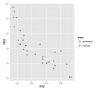
| Figure 5.9 |
| Examples of grouping |
|
| R code |
|
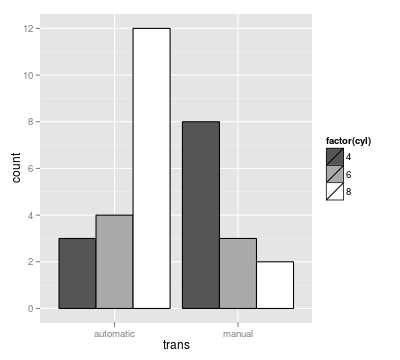
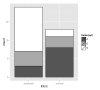
| Figure 5.10 |
| Examples of position adjustment |


|
| R code |
|
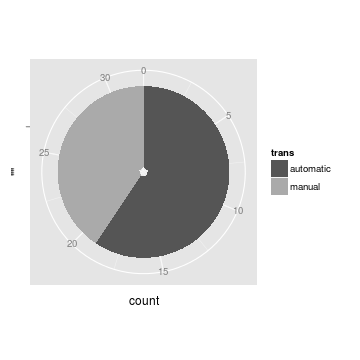
| Figure 5.11 |
| Examples of coordinate transformations |


|
| R code |
|
| Figure 5.12 |
| Coord components in ggplot2 |

|
| R code |
|
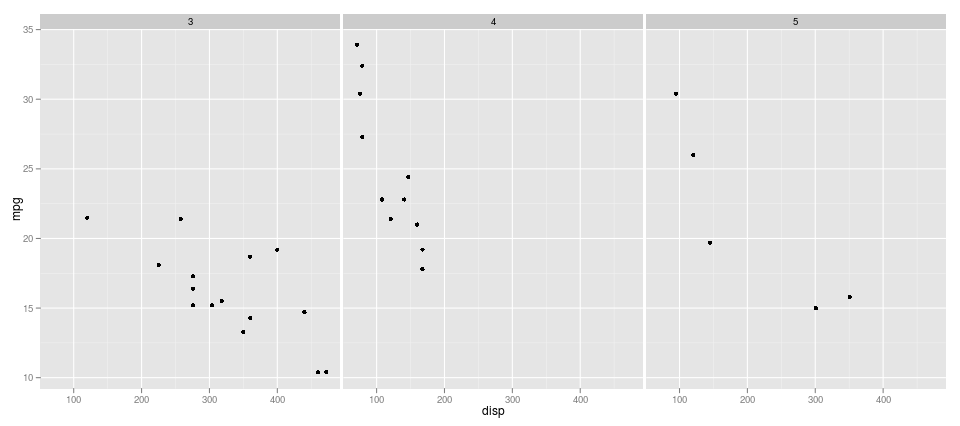
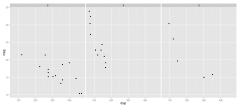
| Figure 5.13 |
| Examples of facetting |
|
| R code |
|
| Figure 5.14 |
| Examples of themes |


|
| R code |
|
| Figure 5.15 |
| Example annotations |


|
| R code |
|