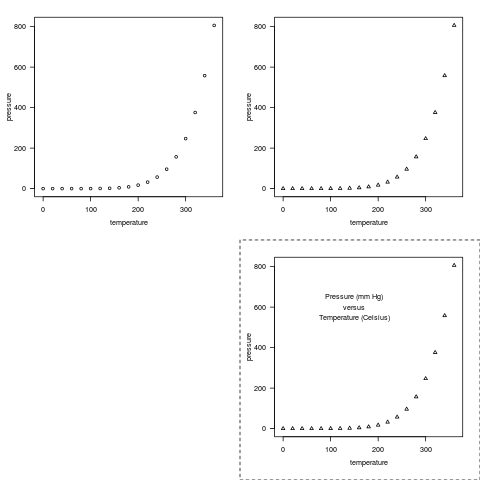
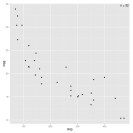
| Figure 6.1 |
| A simple scatterplot using grid. |
|
| R code |
|
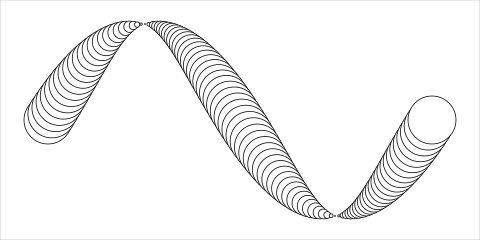
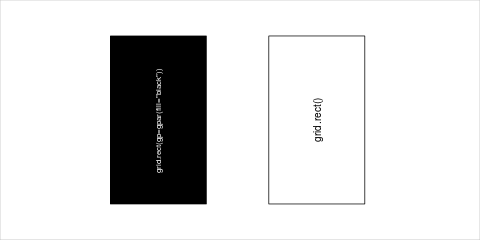
| Figure 6.2 |
| Primitive grid output |
|
| R code |
|
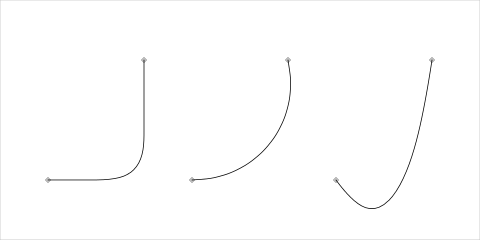
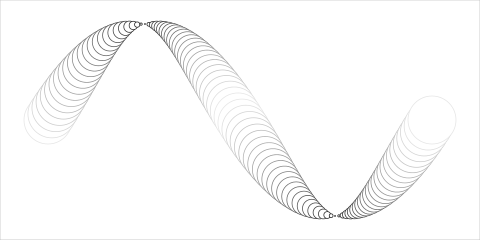
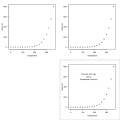
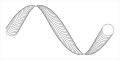
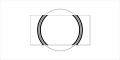
| Figure 6.3 |
| Drawing curves |

|
| R code |
|
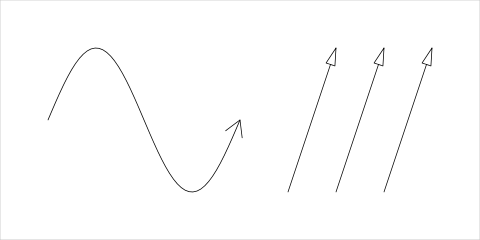
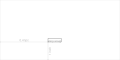
| Figure 6.4 |
| Drawing arrows |

|
| R code |
|
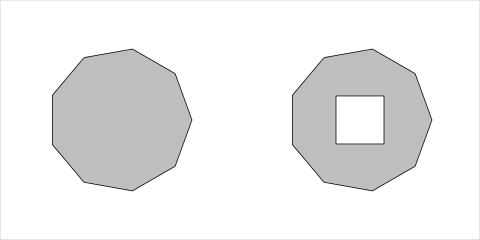
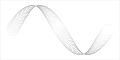
| Figure 6.5 |
| Drawing polygons |

|
| R code |
|
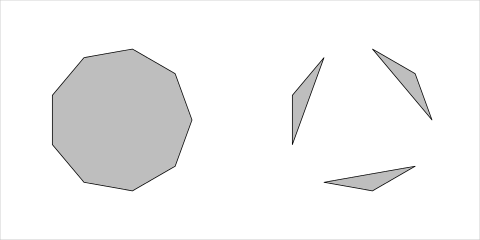
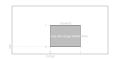
| Figure 6.6 |
| Drawing paths |

|
| R code |
|
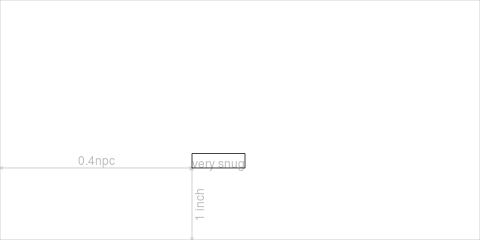
| Figure 6.7 |
| A demonstration of grid units |
|
| R code |
|
| Figure 6.8 |
| Graphical parameters for graphical primitives. |

|
| R code |
|
| Figure 6.9 |
| Recycling graphical parameters. |
|
| R code |
|
| Figure 6.10 |
| Recycling graphical parameters for polygons |

|
| R code |
|
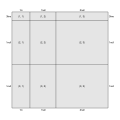
| Figure 6.11 |
| A diagram of a simple viewport |
|
| R code |
|
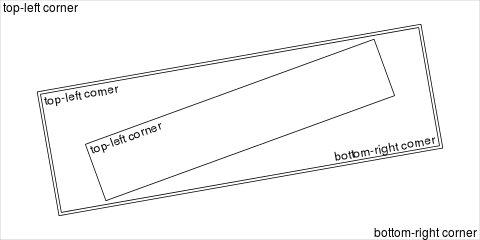
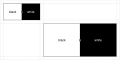
| Figure 6.12 |
| Pushing a viewport |
|
| R code |
|
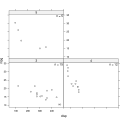
| Figure 6.13 |
| Pushing several viewports |

|
| R code |
|
| Figure 6.14 |
| Popping a viewport |
|
| R code |
|
| Figure 6.15 |
| Navigating between viewports |

|
| R code |
|
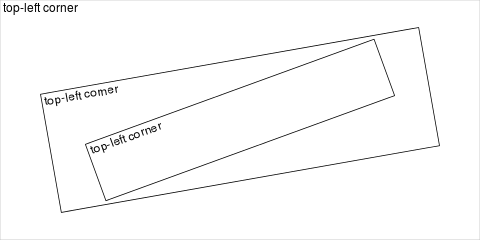
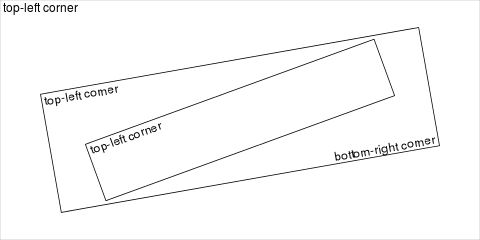
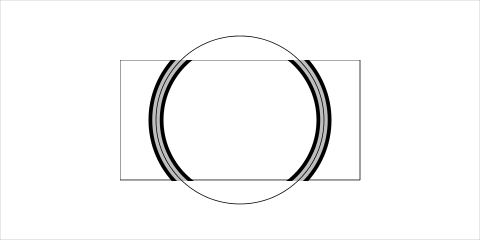
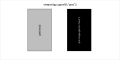
| Figure 6.16 |
| Clipping output in viewports |
|
| R code |
|
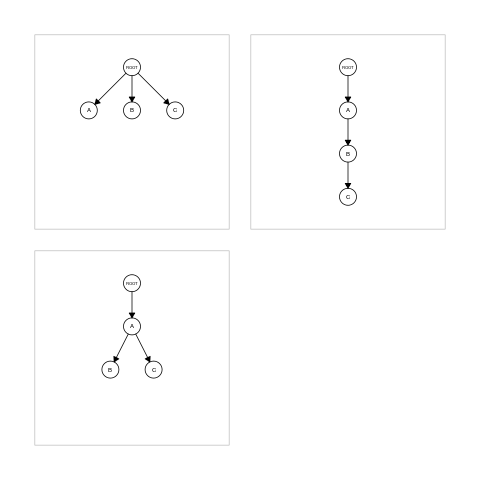
| Figure 6.17 |
| Viewport lists, stacks, and trees |

|
| R code |
|
| Figure 6.18 |
| The inheritance of viewport graphical parameters |
|
| R code |
|
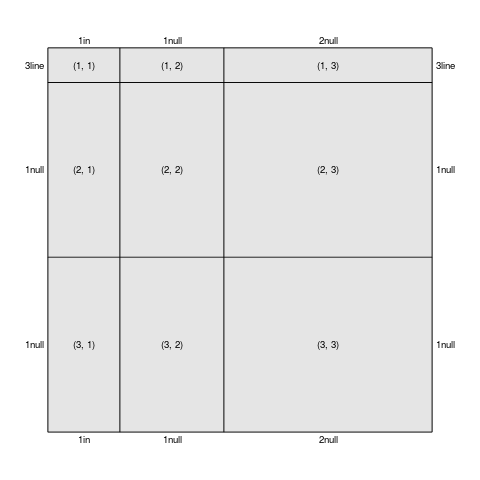
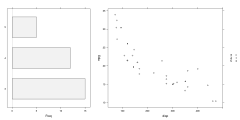
| Figure 6.19 |
| Layouts and viewports |

|
| R code |
|
| Figure 6.20 |
| Layouts and units |
|
| R code |
|
| Figure 6.21 |
| Nested layouts |
|
| R code |
|
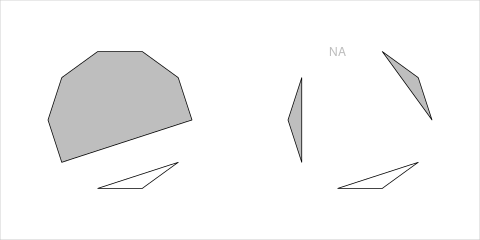
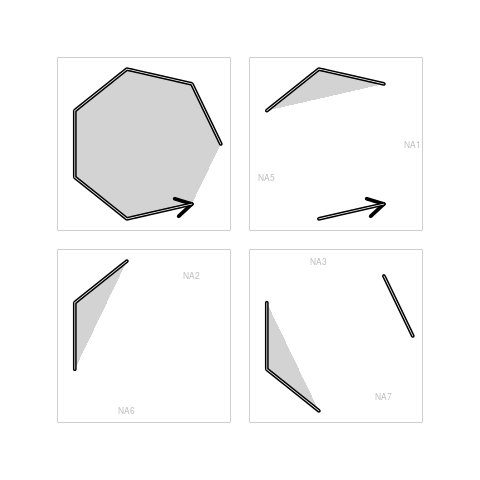
| Figure 6.22 |
| Non-finite values for line-tos, polygons, and arrows |

|
| R code |
|
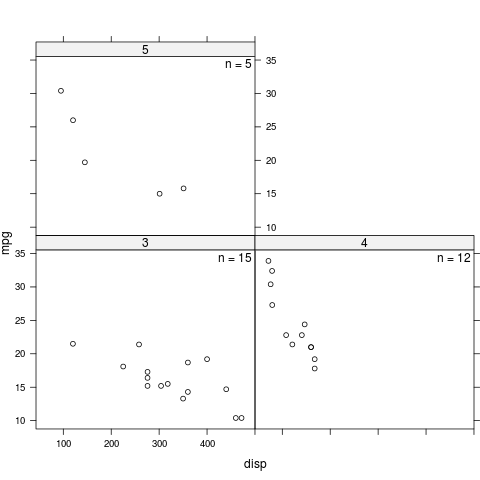
| Figure 6.23 |
| Adding grid output to a lattice plot |
|
| R code |
|
| Figure 6.24 |
| Embedding a lattice plot within grid output |
|
| R code |
|
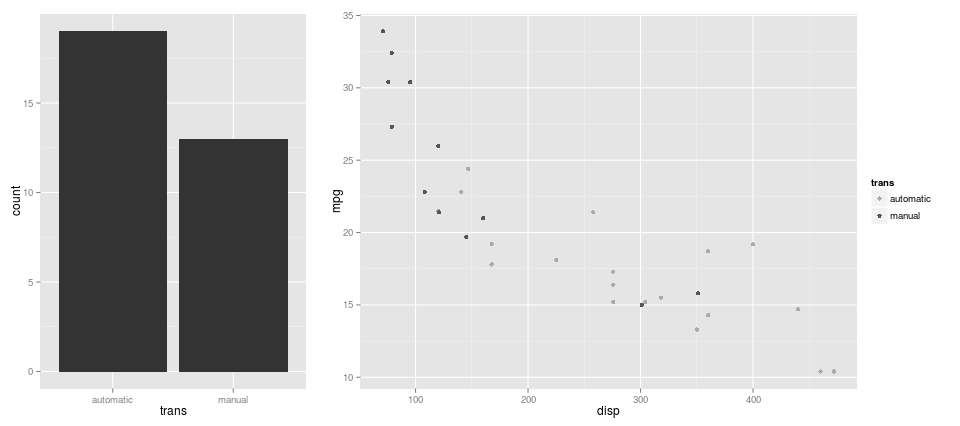
| Figure 6.25 |
| Adding grid output to ggplot2 |
|
| R code |
|
| Figure 6.26 |
| Embedding a ggplot2 plot within grid output |

|
| R code |
|