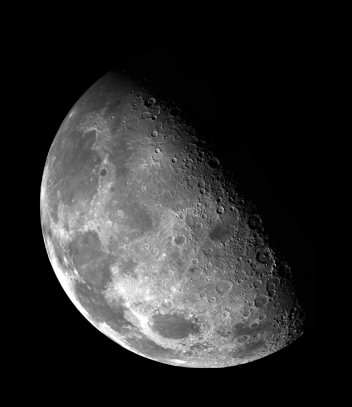
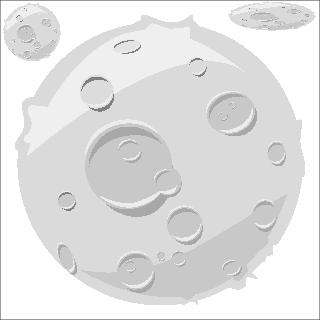
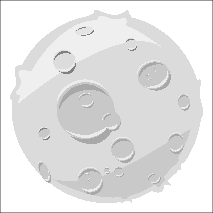
| Figure 11.1 |
| Three images of the Moon |


|
| R code |
|
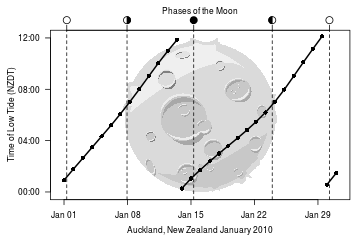
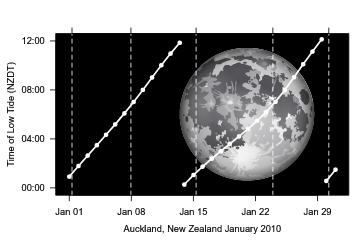
| Figure 11.2 |
| Adding an imported raster image to a plot |

|
| R code |
|
| Figure 11.3 |
| Drawing an imported raster with grid |

|
| R code |
|
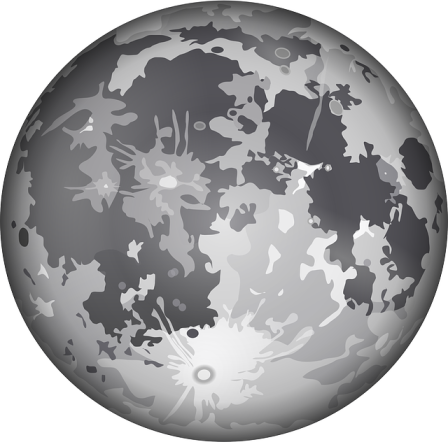
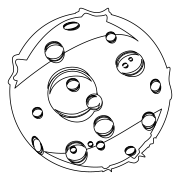
| Figure 11.4 |
| Drawing an imported vector image with grid |

|
| R code |
|
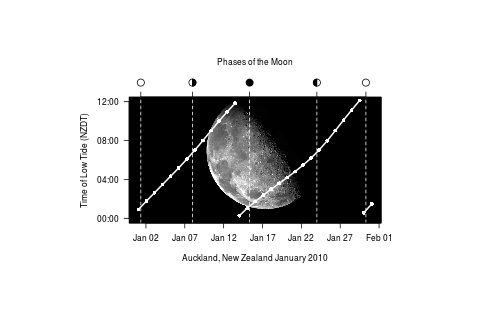
| Figure 11.5 |
| Adding an imported vector image to a plot |

|
| R code |
|
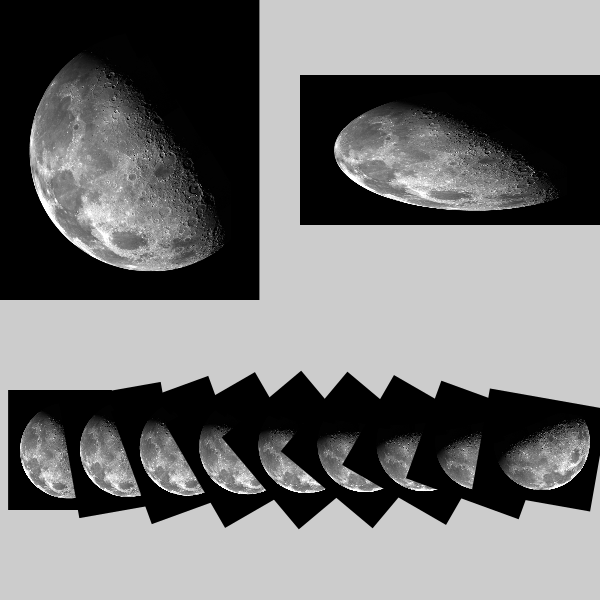
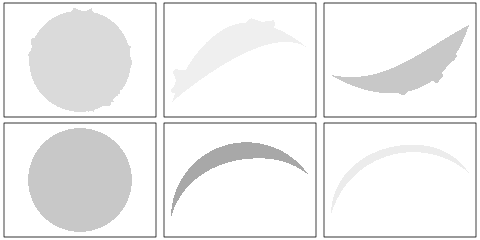
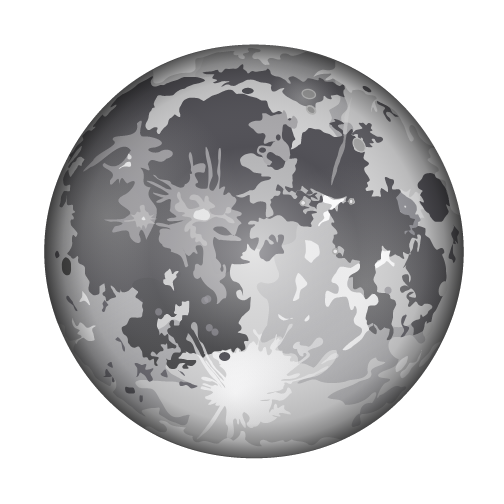
| Figure 11.6 |
| Variations on the Moon |


|
| R code |
|
| Figure 11.7 |
| Breaking a vector image into paths |

|
| R code |
|
| Figure 11.8 |
| A grImport2 rendering of the cartoon moon |

|
| R code |
|
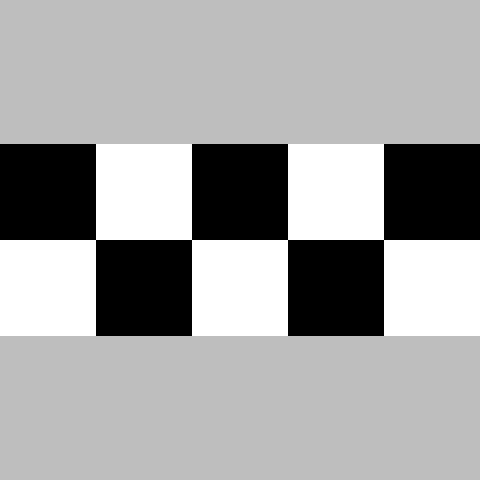
| Figure 11.9 |
| A test image for importing |

|
| R code |
|
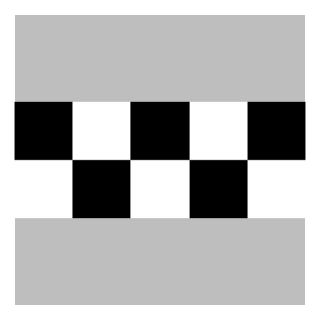
| Figure 11.10 |
| The test image from grImport |

|
| R code |
|
| Figure 11.11 |
| The test image from grImport2 |

|
| R code |
|
| Figure 11.12 |
| An image with radial gradients on a normal device |

|
| R code |
|
| Figure 11.13 |
| An image with radial gradients on a gridSVG device |
|
| R code |
|
| Figure 11.14 |
| Adding a complex imported vector image to a plot |

|
| R code |
|