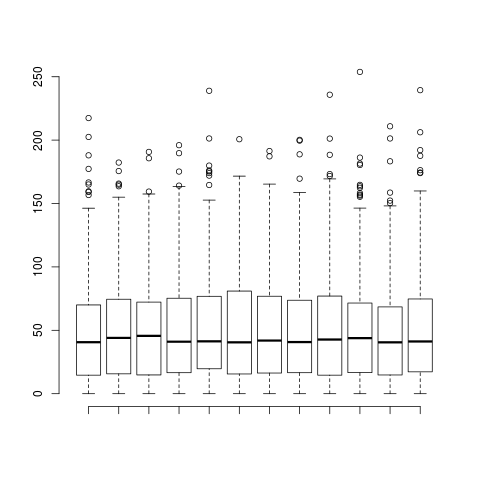
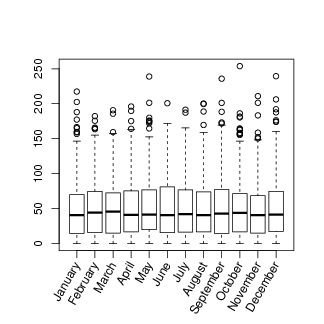
| Figure 12.1 |
| A base plot with no x-axis labels |
|
| R code |
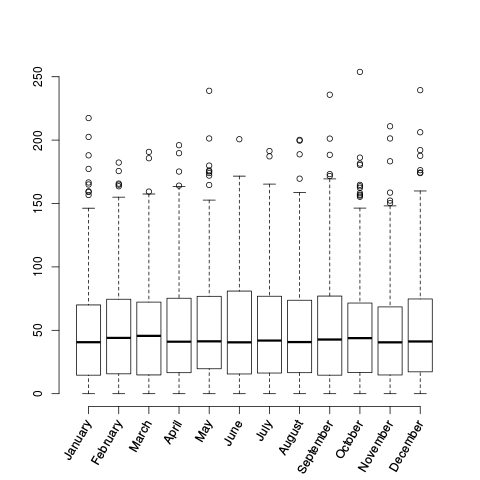
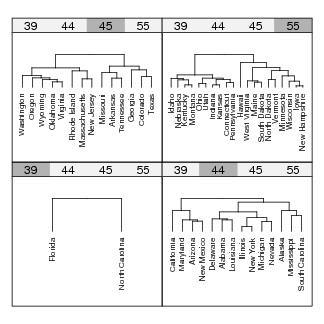
| Figure 12.2 |
| Annotating a base plot with grid |
|
| R code |
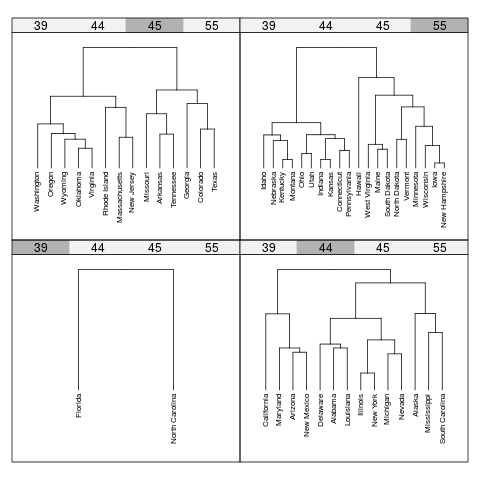
| Figure 12.3 |
| Embedding a base plot within lattice output |
|
| R code |
| Figure 12.4 |
| A base barplot |
|
| R code |
| Figure 12.5 |
| A grid version of a base barplot |
|
| R code |
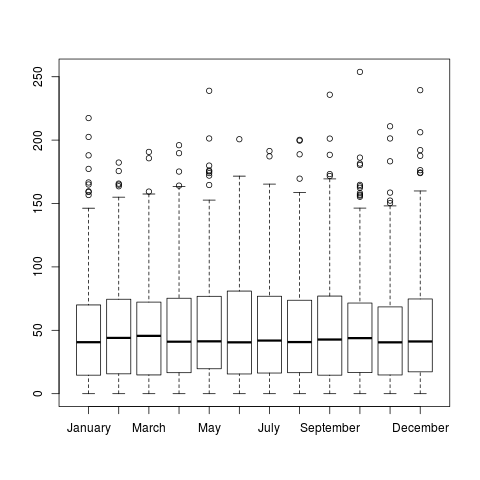
| Figure 12.6 |
| Embedding a base plot with grid.echo() |
|
| R code |
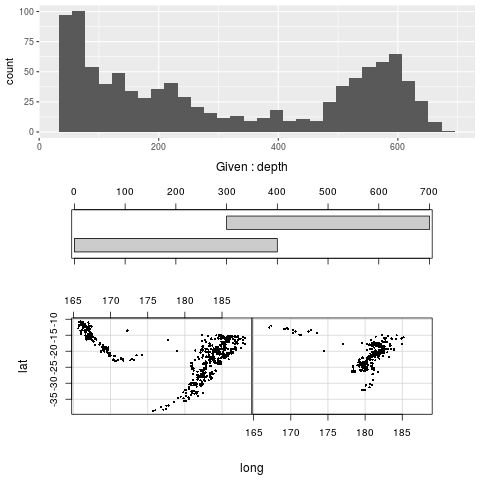
| Figure 12.7 |
| Combining a base plot with a ggplot2 plot |
|
| R code |