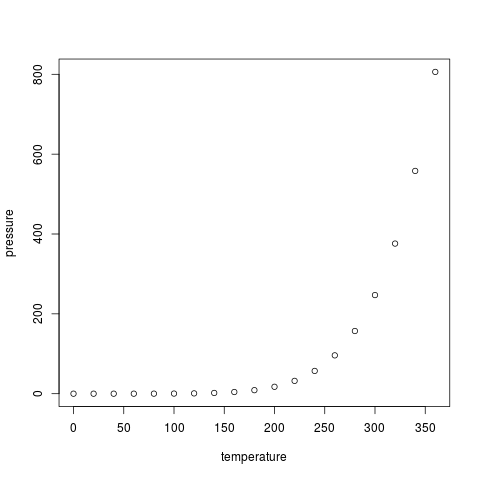
| Figure 2.1 |
| A scatterplot produced by the plot() function |
|
| R code |
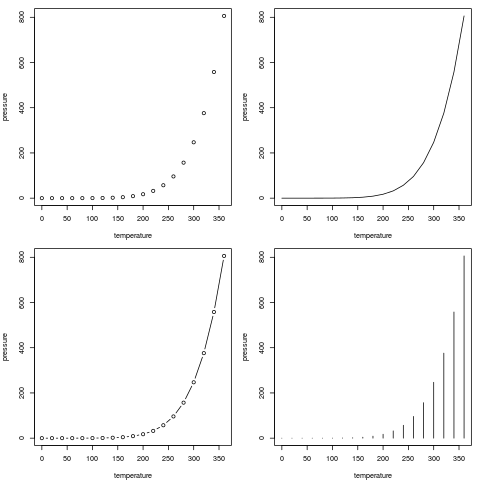
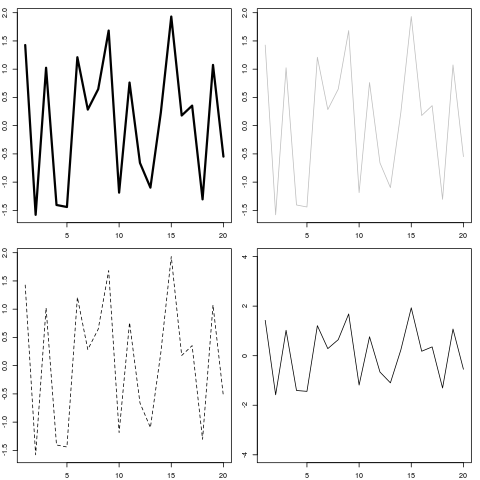
| Figure 2.2 |
| Four variations on a scatterplot |
|
| R code |
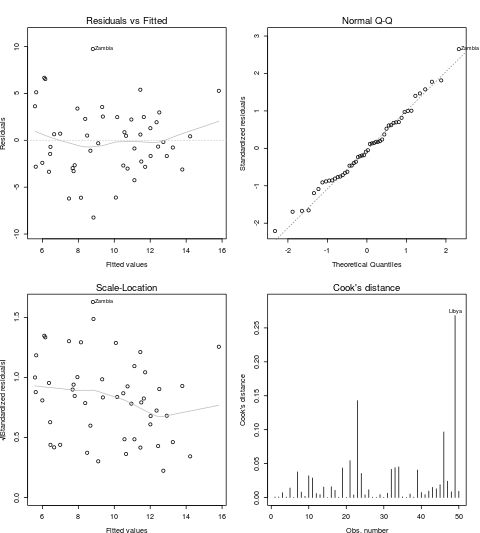
| Figure 2.3 |
| Plotting an "lm" object |
|
| R code |
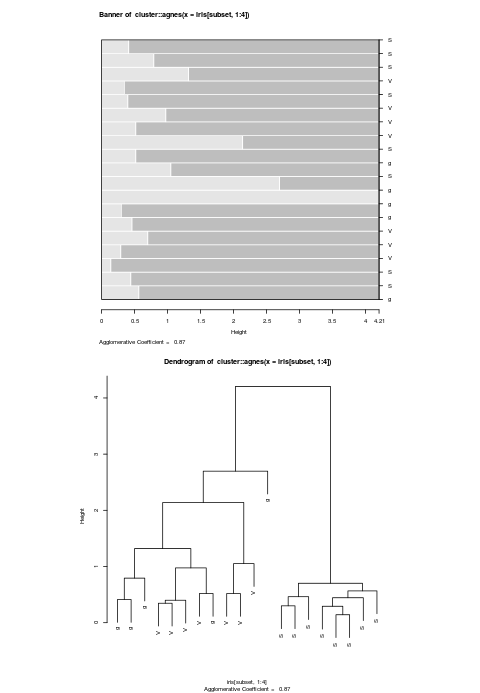
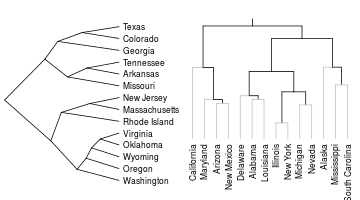
| Figure 2.4 |
| Plotting an agnes object |
|
| R code |
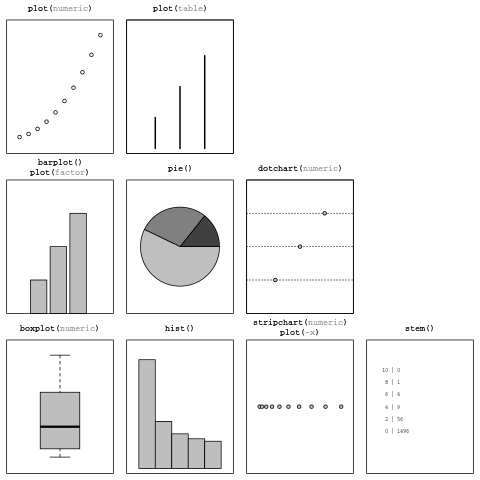
| Figure 2.5 |
| Plots for a single variable |
|
| R code |
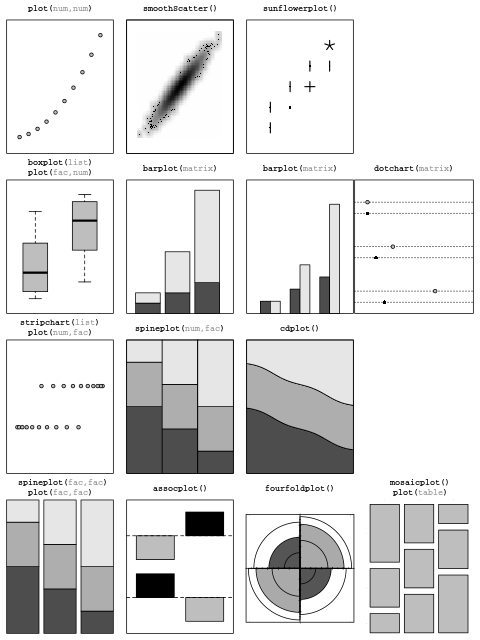
| Figure 2.6 |
| Plots of two variables |
|
| R code |
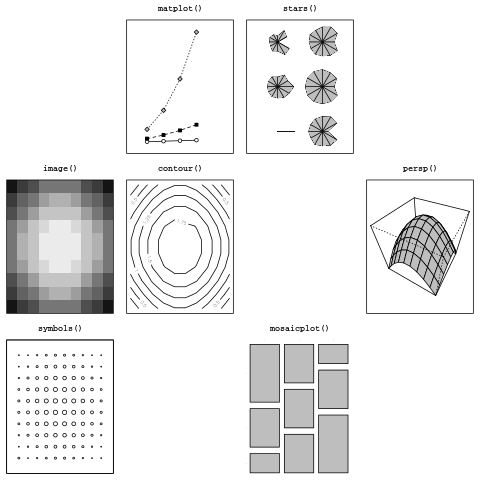
| Figure 2.7 |
| Plots of many variables |
|
| R code |
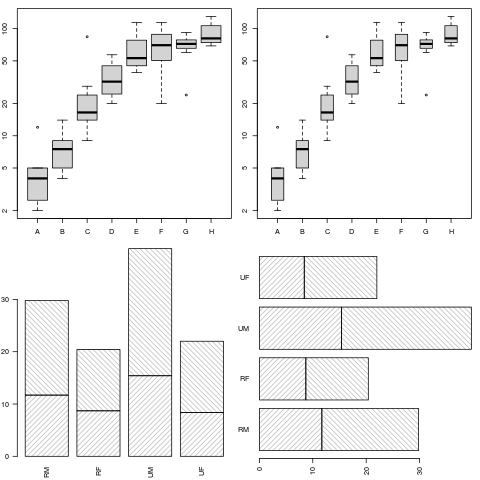
| Figure 2.8 |
| Modifying default barplot() and boxplot() output |
|
| R code |
| Figure 2.9 |
| Standard arguments for high-level functions |
|
| R code |
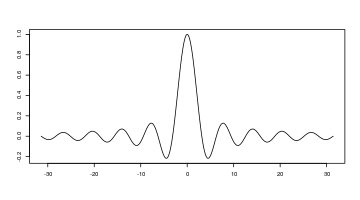
| Figure 2.10 |
| Some specialized plots |
|
| R code |