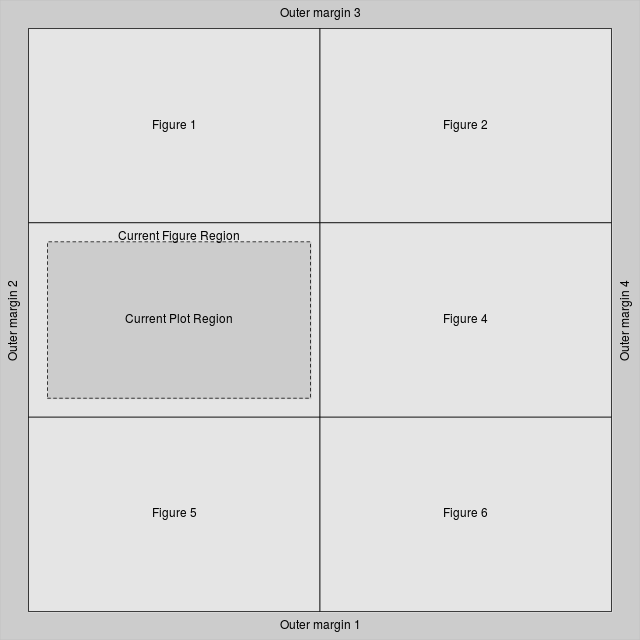
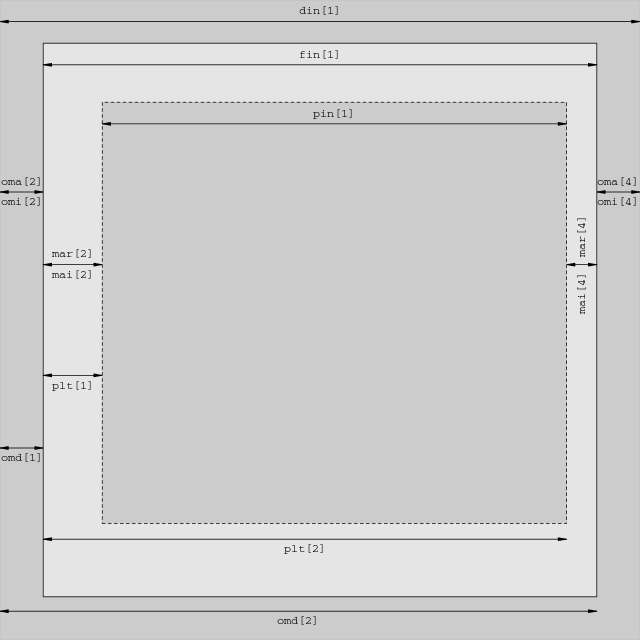
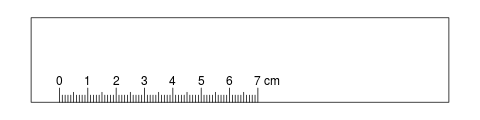
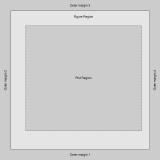
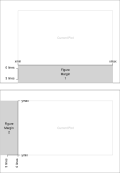
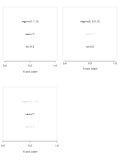
| Figure 3.1 |
| The plot regions in base graphics |
|
| R code |
|
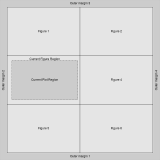
| Figure 3.2 |
| Multiple figure regions in base graphics |
|
| R code |
|
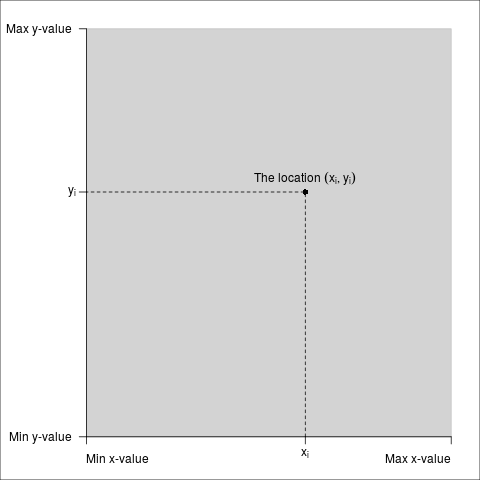
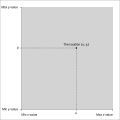
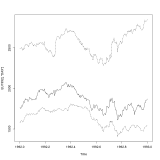
| Figure 3.3 |
| The user coordinate system in the plot region |
|
| R code |
|
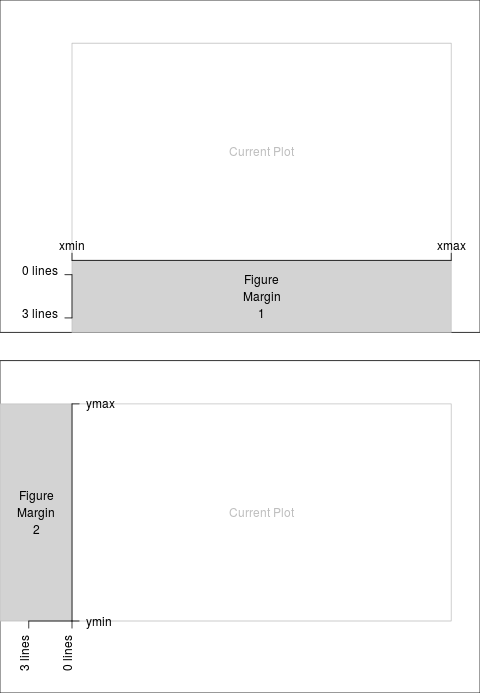
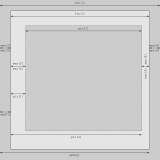
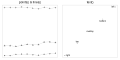
| Figure 3.4 |
| Figure margin coordinate systems |
|
| R code |
|
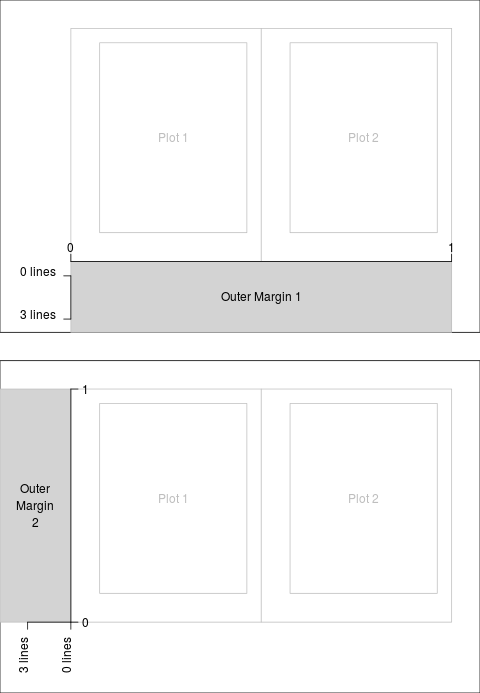
| Figure 3.5 |
| Outer margin coordinate systems |

|
| R code |
|
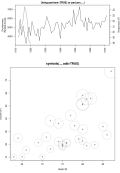
| Figure 3.6 |
| Persistent versus temporary graphical settings |
|
| R code |
|
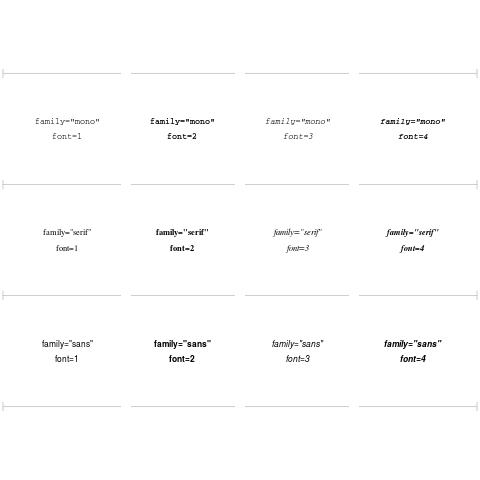
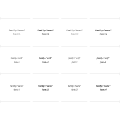
| Figure 3.7 |
| Font families and font faces |
|
| R code |
|
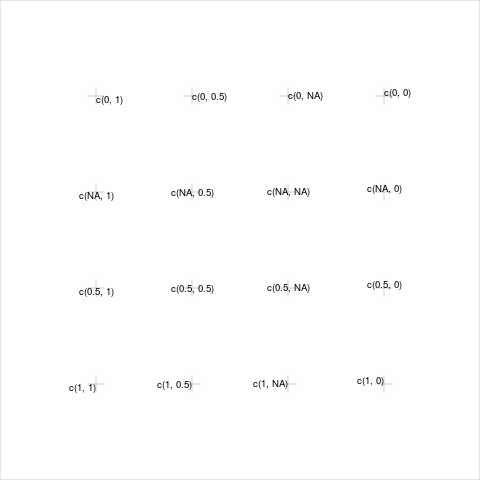
| Figure 3.8 |
| Alignment of text in the plot region |
|
| R code |
|
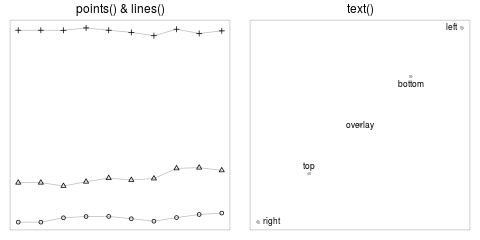
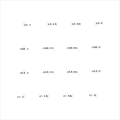
| Figure 3.9 |
| Data symbols in base graphics |

|
| R code |
|
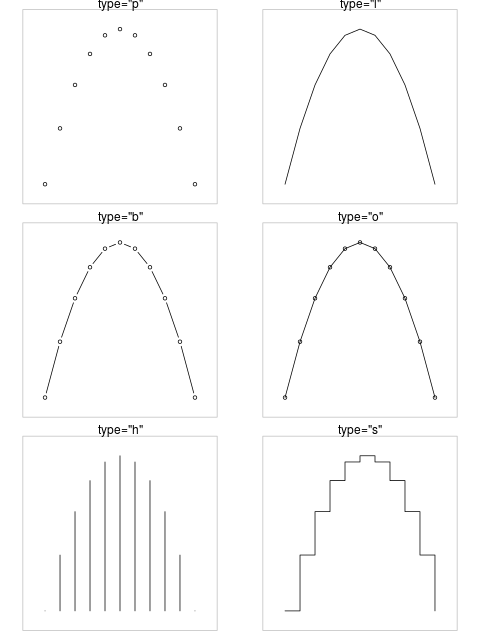
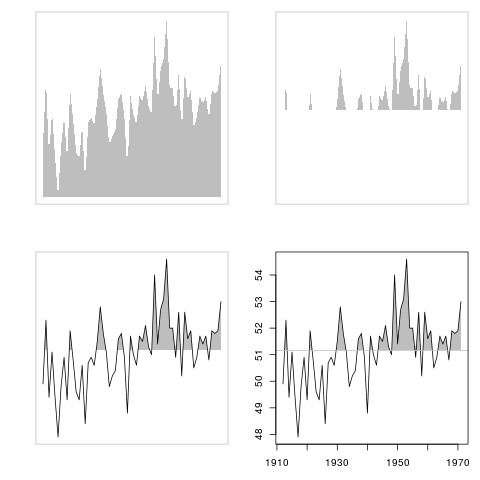
| Figure 3.10 |
| Basic plot types |

|
| R code |
|
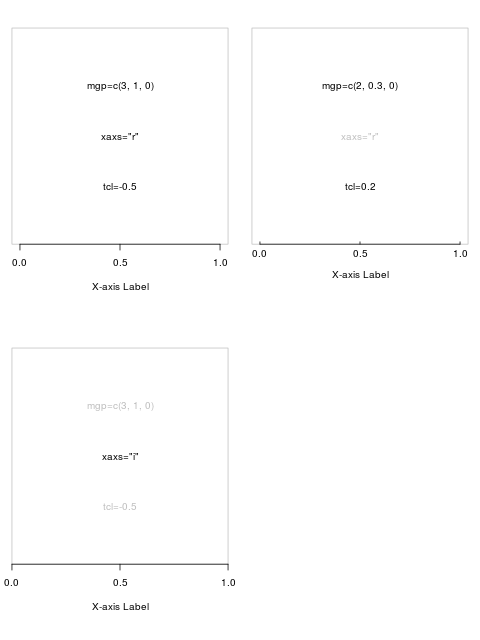
| Figure 3.11 |
| Different axis styles |
|
| R code |
|
| Figure 3.12 |
| Graphics state settings controlling plot regions |
|
| R code |
|
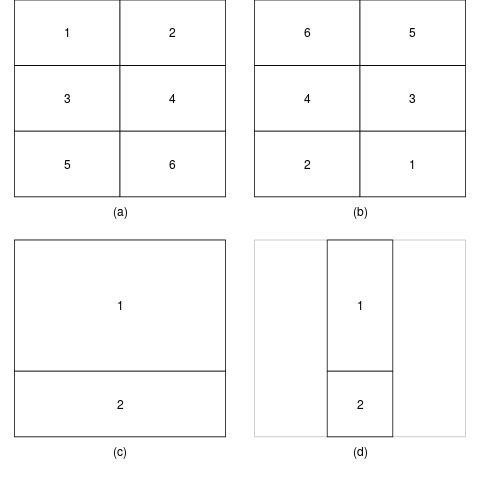
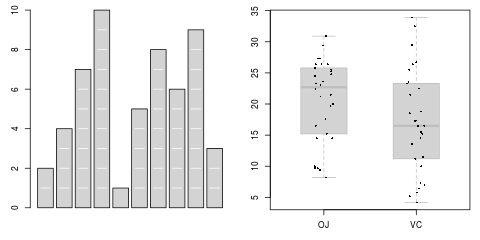
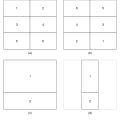
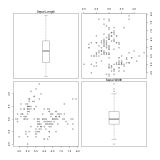
| Figure 3.13 |
| Some basic layouts |
|
| R code |
|
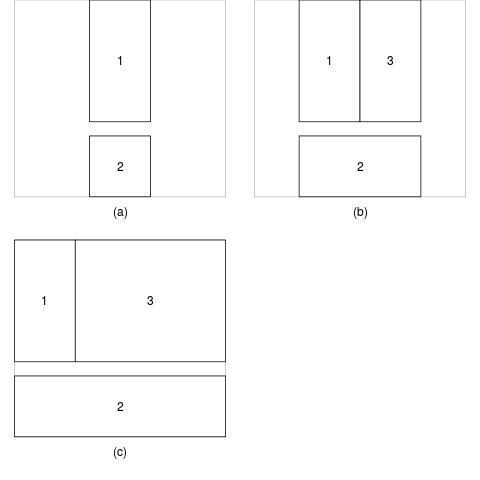
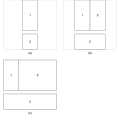
| Figure 3.14 |
| Some complex layouts |
|
| R code |
|
| Figure 3.15 |
| Annotating the plot region |
|
| R code |
|
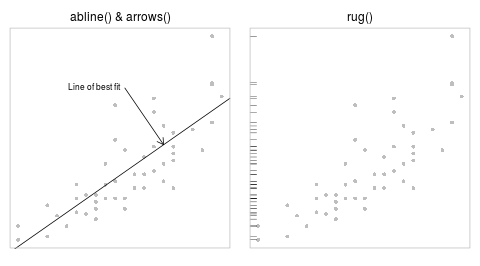
| Figure 3.16 |
| Drawing in the plot region |
|
| R code |
|
| Figure 3.17 |
| More examples of annotating the plot region |

|
| R code |
|
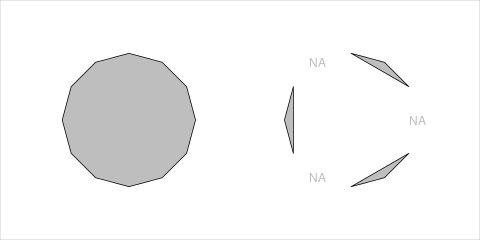
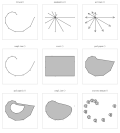
| Figure 3.18 |
| Drawing polygons |

|
| R code |
|
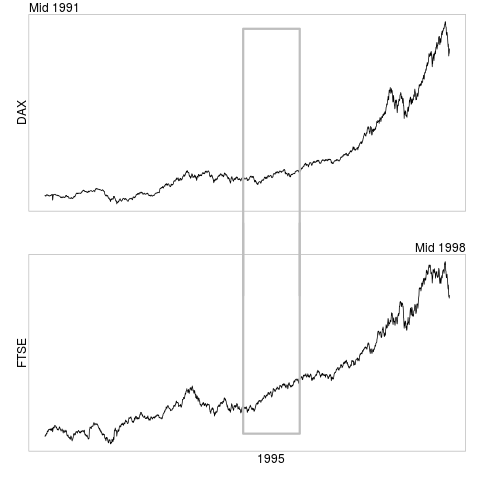
| Figure 3.19 |
| Annotating the margins |

|
| R code |
|
| Figure 3.20 |
| Some simple legends |
|
| R code |
|
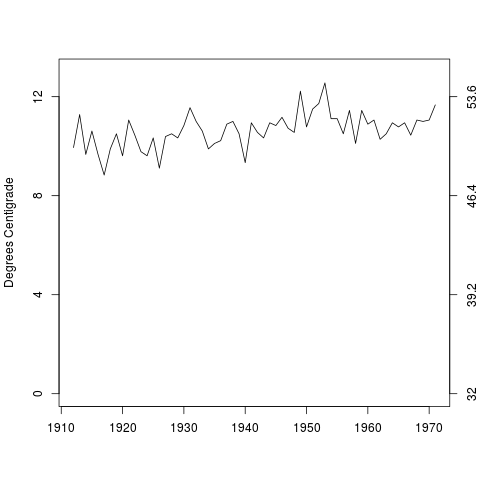
| Figure 3.21 |
| Customizing axes |
|
| R code |
|
| Figure 3.22 |
| Custom coordinate systems |

|
| R code |
|
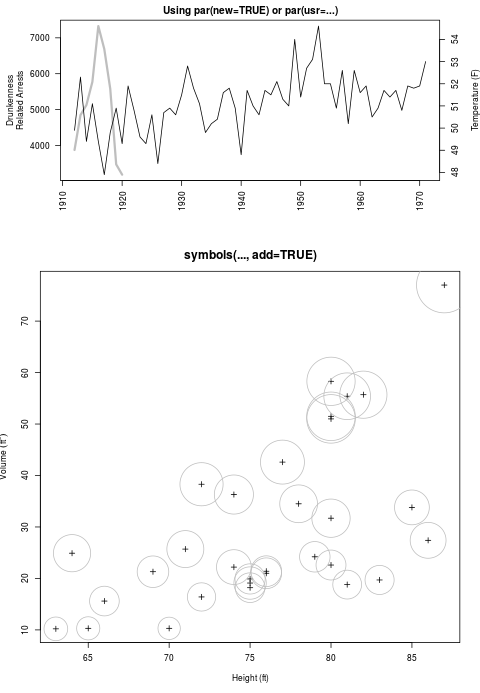
| Figure 3.23 |
| Overlaying plots |
|
| R code |
|
| Figure 3.24 |
| Overlaying output |

|
| R code |
|
| Figure 3.25 |
| Special-case annotations |

|
| R code |
|
| Figure 3.26 |
| A panel function example |
|
| R code |
|
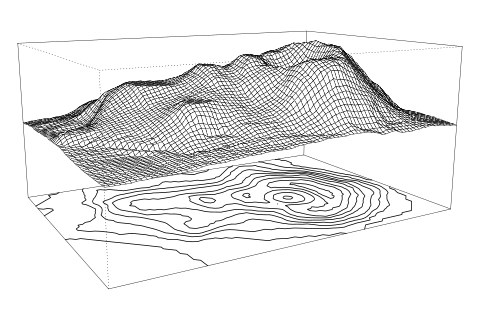
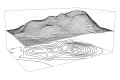
| Figure 3.27 |
| Annotating a 3D surface |
|
| R code |
|
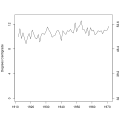
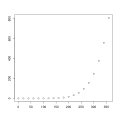
| Figure 3.28 |
| A simple scatterplot from scratch |
|
| R code |
|
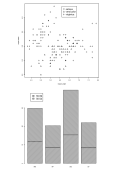
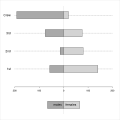
| Figure 3.29 |
| A back-to-back barplot |
|
| R code |
|
| Figure 3.30 |
| A graphics function template |
|
|
| R code |
|