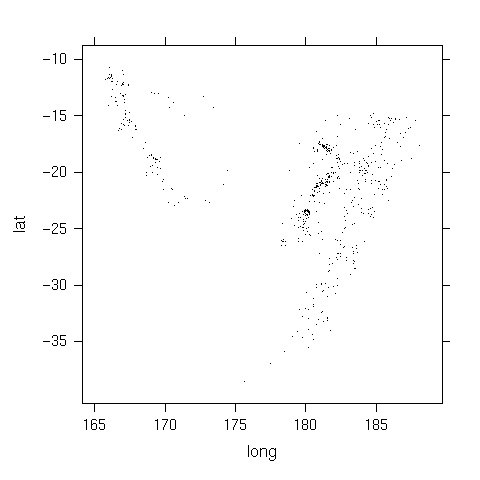
| Figure 4.1 |
| A scatterplot using lattice |
|
| R code |
| Figure 4.2 |
| The result of modifying a lattice object |

|
| R code |
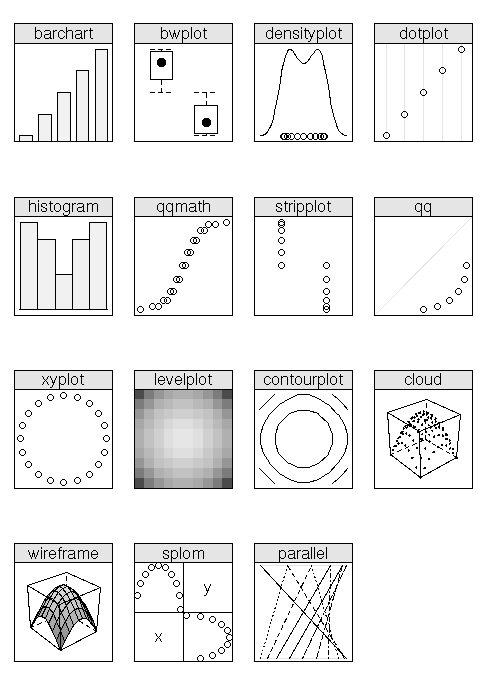
| Figure 4.3 |
| Plot types available in lattice |
|
| R code |
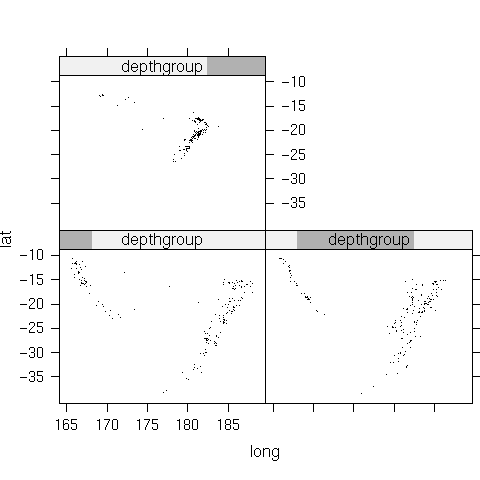
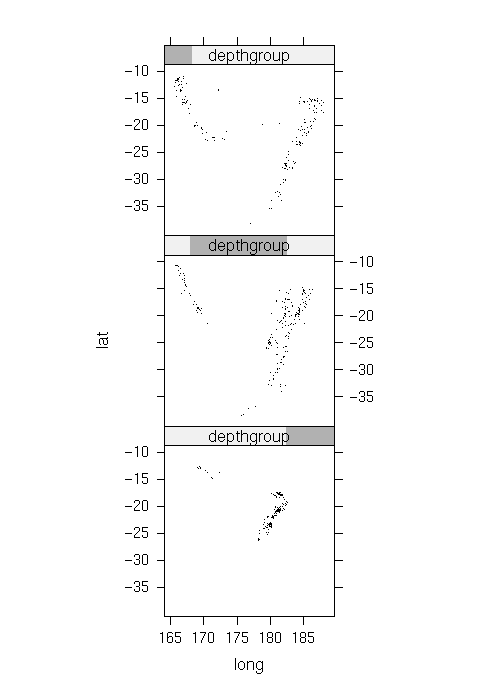
| Figure 4.4 |
| A lattice multipanel conditioning plot |
|
| R code |
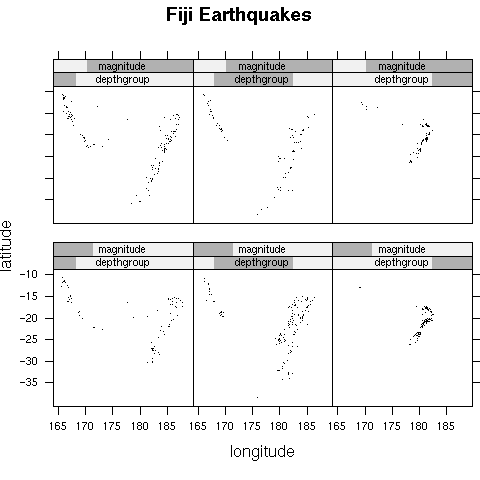
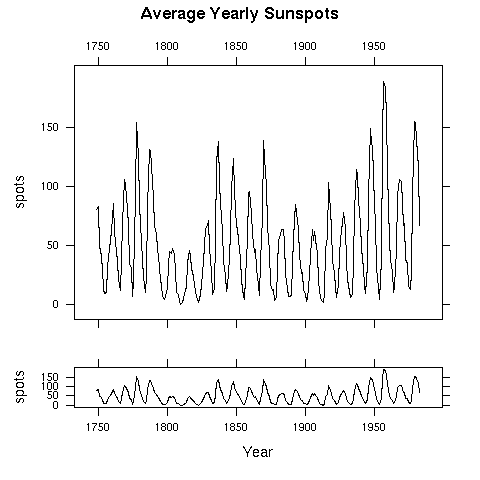
| Figure 4.5 |
| A complex lattice plot |
|
| R code |
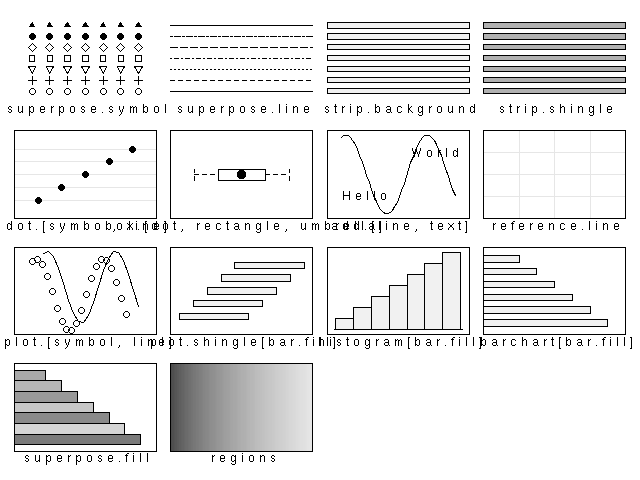
| Figure 4.6 |
| Some default lattice settings |
|
| R code |
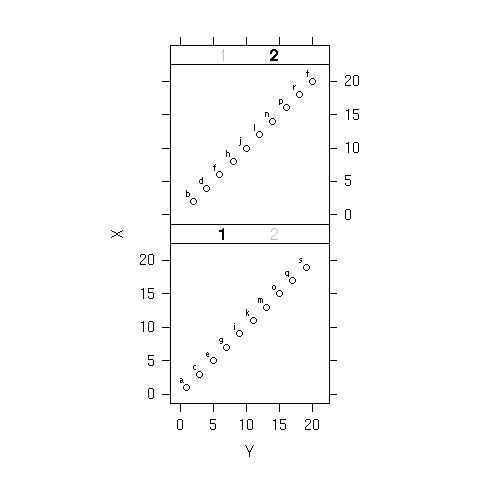
| Figure 4.7 |
| Controlling the layout of lattice panels |
|
| R code |
| Figure 4.8 |
| Arranging multiple lattice plots |
|
| R code |
| Figure 4.9 |
| Annotating a lattice plot |
|
| R code |