 http://orcid.org/0000-0002-3224-8858
by Paul Murrell
http://orcid.org/0000-0002-3224-8858
Wednesday 14 September 2016
This report describes changes in version 0.2 of the 'DOM' package for R. Version 0.1 of 'DOM' allowed HTML content to be added to a web page (or removed or modified); version 0.2 adds the ability to append SVG content to a web page.
library("DOM")
It is now possible to add SVG content to a web page with the 'DOM'
package.
The functions appendChild and replaceChild
have a new argument ns, which can be set to "SVG"
to add SVG elements to the page. For example, the following creates
a simple web page with a normal
paragraph of text followed by an SVG circle.
  page <- htmlPage("<p>The circle below is SVG content.</p>")
  svg <- paste0('<svg xmlns="http://www.w3.org/2000/svg" ',
                '     width="100" height="100">',
                '  <circle cx="50" cy="50" r="50"/>',
                '</svg>')
  appendChild(page, svg, ns="SVG")
  <svg xmlns="http://www.w3.org/2000/svg" width="100" height="100">
   <circle cx="50" cy="50" r="50"/>
  </svg>

For this to work properly (in all browsers tested so far; firefox, chrome,
and phantomjs), it is important that, when the
ns argument is specified, the top-level element
that is being added has
an xmlns attribute with the appropriate namespace URI.
In the case of SVG, this is
"http://www.w3.org/2000/svg".
The only other valid value for the ns argument at present
is "HTML". This can be used
to append HTML content within SVG. The example below
adds a <foreignObject> to the SVG image and then adds an
HTML paragraph within that <foreignObject>. This
demonstrates two important points: only one XML namespace can be
used at once, so we must add the <foreignObject>, which is from
the SVG namespace, separately from
the HTML content, which has an HTML namespace;
and, as in the example above, for each append that uses a namespace,
the top-level element must have an appropriate
xmlns attribute. In the case of HTML,
the appropriate namespace is "http://www.w3.org/1999/xhtml".
  fo <- paste0('<foreignObject xmlns="http://www.w3.org/2000/svg" ',
               '               x="20" y="20" width="60" height="60" ',
               '               id="fo">',
               '</foreignObject>')
  appendChild(page, fo, ns="SVG", parentRef="svg")
<foreignObject xmlns="http://www.w3.org/2000/svg" x="20" y="20" width="60" height="60" id="fo"/>
  html <- paste0('<p xmlns="http://www.w3.org/1999/xhtml" ',
                 '   style="color: white; font-size: small; ',
                 '          line-height: 1; text-align: center;',
                 '          margin-top: 0px">',
                 'This is HTML text in SVG',
                 '</p>')
  appendChild(page, html, ns="HTML", parentRef="#fo")
<p xmlns="http://www.w3.org/1999/xhtml" style="color: white; font-size: small; line-height: 1; text-align: center; margin-top: 0px">This is HTML text in SVG</p>

The following code combines the new ability to add SVG content to a web page with the existing ability to call back to R from the browser to create a simple interactive plot in the web page.
The first step is to create an SVG plot. The code below
uses 'lattice' to draw a plot using the mtcars
data set and then 'gridSVG' to create
an SVG version of the plot (in memory).
  library(lattice)
  xyplot(mpg ~ disp, mtcars, pch=16, col="black", cex=1.5)
  library(gridSVG)
  svg <- grid.export(NULL)$svg
The next step involves modifying the SVG so that every data symbol
has an onclick attribute that will call the R function
info(). We are doing this in R using the 'XML' package,
before we add the SVG to the web page; we could alternatively
add the SVG to the web page and then use 'DOM' to modify the symbols.
This code makes use of the fact that the 'lattice' data symbols
have been exported by 'gridSVG' as <use> elements in the
SVG code.
  library(XML)
  points <- getNodeSet(svg, "//svg:use",
                       namespaces=c(svg="http://www.w3.org/2000/svg"))
  for (node in points) {
      xmlAttrs(node) <- c(onclick="RDOM.Rcall('info', this, null)",
                          "pointer-events"="all")
  }
Now we use 'DOM' to start a web page and add the SVG plot to the page. The web page has a paragraph of instructions at the top and an empty <pre> element at the bottom.
  library(DOM)
  page <- htmlPage('<p id="instructions">Click a point to see more info</p>')
  appendChild(page, saveXML(svg), ns="SVG")
  appendChild(page, '<pre id="info"></pre>')

Finally, we define the info() function. This
will identify which data symbol was clicked, select the
corresponding row of data from the mtcars data
set, generate a <pre> element containing that row
of data, and replace the <pre> element
at the bottom of the page with this new
<pre> element.
This code makes use of the fact that the data symbols are exported
as <use> symbols each with its own id,
e.g., plot_01.xyplot.points.panel.1.1.1.4,
and the final digit in the id represents the
index of the data symbol within the data set.
  info <- function(elt, css) {
      index <- as.numeric(gsub(".+[.]", "", css))
      replaceChild(page,
                   paste0('<pre id="info">',
                          paste(capture.output(mtcars[index, ]),
                                collapse="\n"),
                          "</pre>"),
                   oldChildRef="#info",
                   async=TRUE)
  }
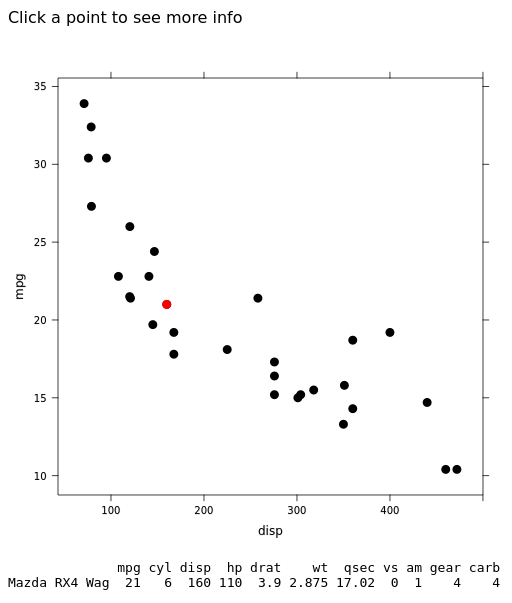
Now, if we click on a data symbol in the plot (in the web browser),
the info() function is called (in R) and information about
the clicked point is displayed (in the web browser). In the
image below, the clicked point is highlighted in red.
Version 0.2 of the 'DOM' package adds the ability to append SVG content to a web page (in addition to HTML content). This makes it possible to dynamically add graphical output to a web page from an R session.
The examples and discussion in this document relate to version 0.2 of the 'DOM' package.
This report was generated on Ubuntu 14.04 64-bit running
R version 3.3.1 (2016-06-21) and PhantomJS version 2.1.1.

An Introduction to the 'DOM' Package
by Paul
Murrell is licensed under a Creative
Commons Attribution 4.0 International License.