Example 6: subgraphs

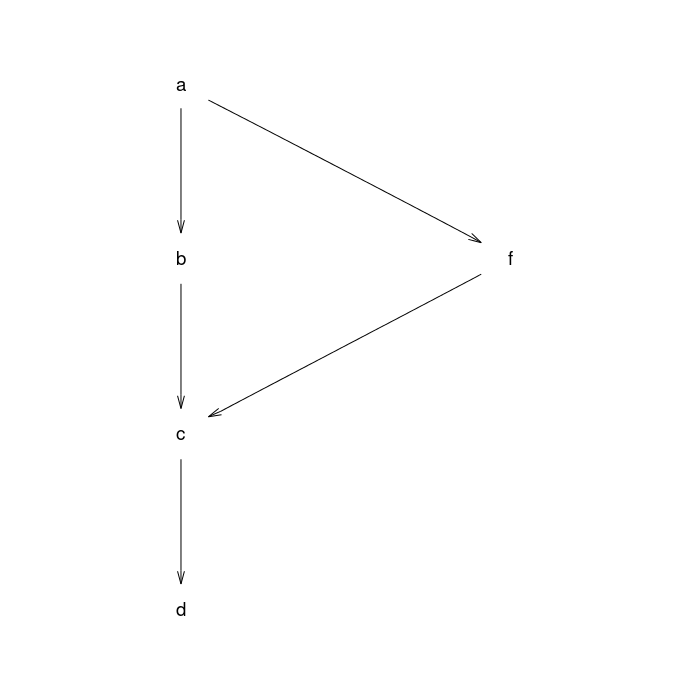
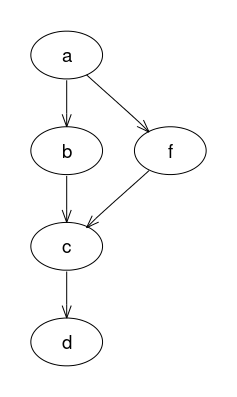
An directed graph with 5 nodes, 5 edges, and two labelled subgraphs.

Graph declaration

In all cases the graph is explicitly declared with ellipse shaped nodes. The dot file edges are declared in alphabetical order as this is the (assumed) default for how Rgraphviz will pass edges internally to graphviz.

Dot file for graphviz:


digraph { 
  node [shape=ellipse];

  subgraph cluster_0 { 
      label="Subgraph A"; 
      //nodes
      a b c d;
      
      //edges
      a -> b; 
      b -> c; 
      c -> d; 
  } 
  subgraph cluster_1 { 
      label="Subgraph B"; 
      //nodes
      f
      
      //edges
      a -> f; 
      f -> c; 
  }
}
	  

R code for Rgraphviz and gridGraphviz:

# load Rgraphviz library
library(Rgraphviz)

# nodes
nodes <- c(letters[1:4], "f")

#edges
edgeList <- list(a=list(edges=c("b", "f")),
                 b=list(edges=c("c")),
                 c=list(edges=c("d")),
                 d=list(),
                 f=list(edges=c("c")))

graph <- new("graphNEL", nodes=nodes, edgeL=edgeList, edgemode="directed")

# subgraphs
sgL <- list()
sg1 <- subGraph(letters[1:4], graph)
sg2 <- subGraph("f", graph)
sgL[[1]] <- list(graph=sg1, attrs = c(label = "Subgraph A"))
sgL[[2]] <- list(graph=sg2, attrs = c(label = "Subgraph B"))

Graph rendering:

graphviz

Rgraphviz

gridGraphviz (old)

gridGraphviz (new)

>> dot -Tpng ex6.dot -o ex6.png
    
graphviz output
# create Ragraph object
rag <- agopen(graph, "", subGList=sgL, attrs=list(node=list(shape="ellipse")))
#plot  
plot(rag)
plot of chunk Rgraphviz-ex6
library(gridGraphviz)

# create Ragraph object
rag <- agopen(graph, "", subGList=sgL, attrs=list(node=list(shape="ellipse")))
#plot  
grid.graph(rag)
## Warning: Unsupported node shape; using 'box'
plot of chunk gridGraphviz-old-ex6
library(gridGraphviz)

# create Ragraph object
rag <- agopenTrue(graph, "", subGList=sgL,
           attrs=list(node=list(shape="ellipse")))
#plot  
grid.graph(rag)
plot of chunk gridGraphviz-new-ex6

Discussion

gridGraphviz (old) fails to produce ellipse shaped nodes, does not label or subgraphs, or place inside boxes.