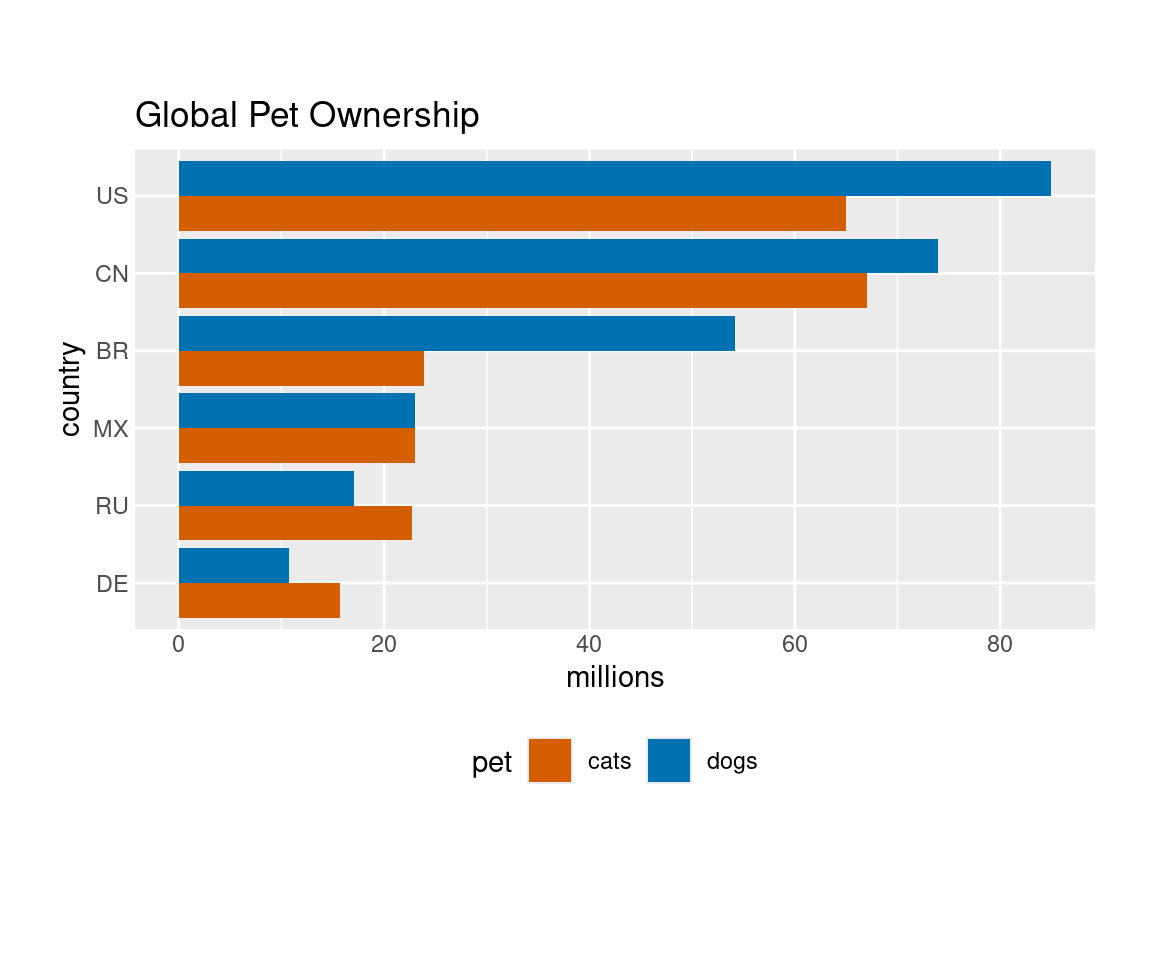
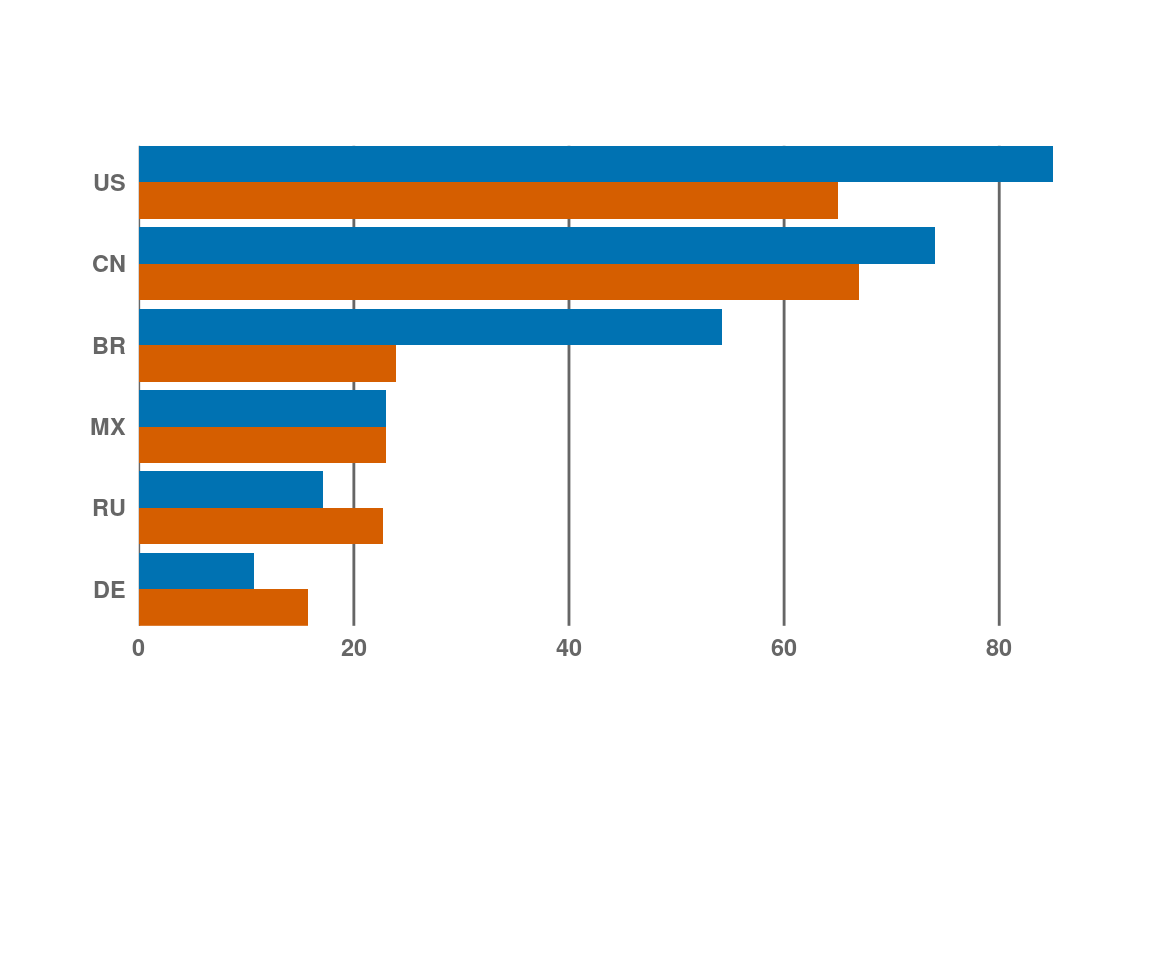
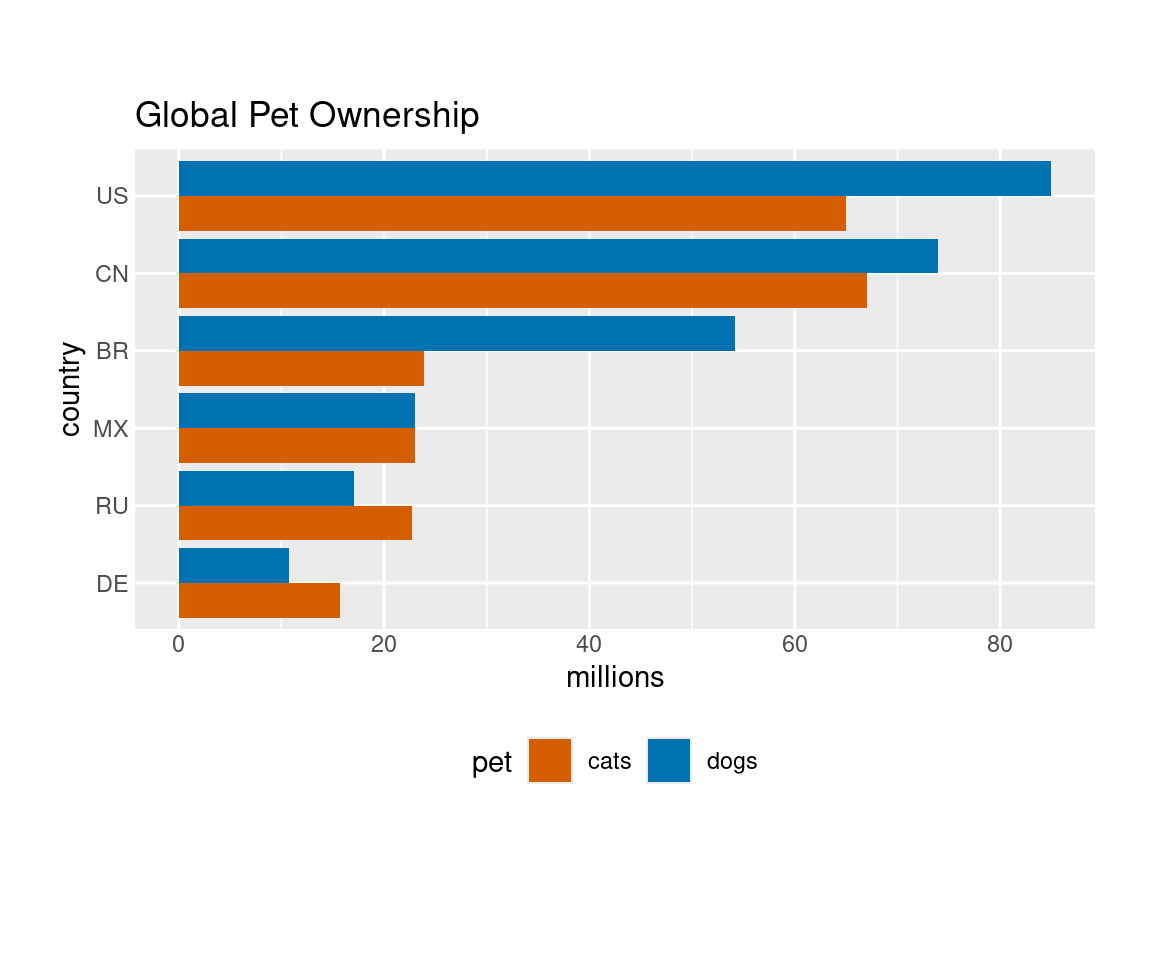
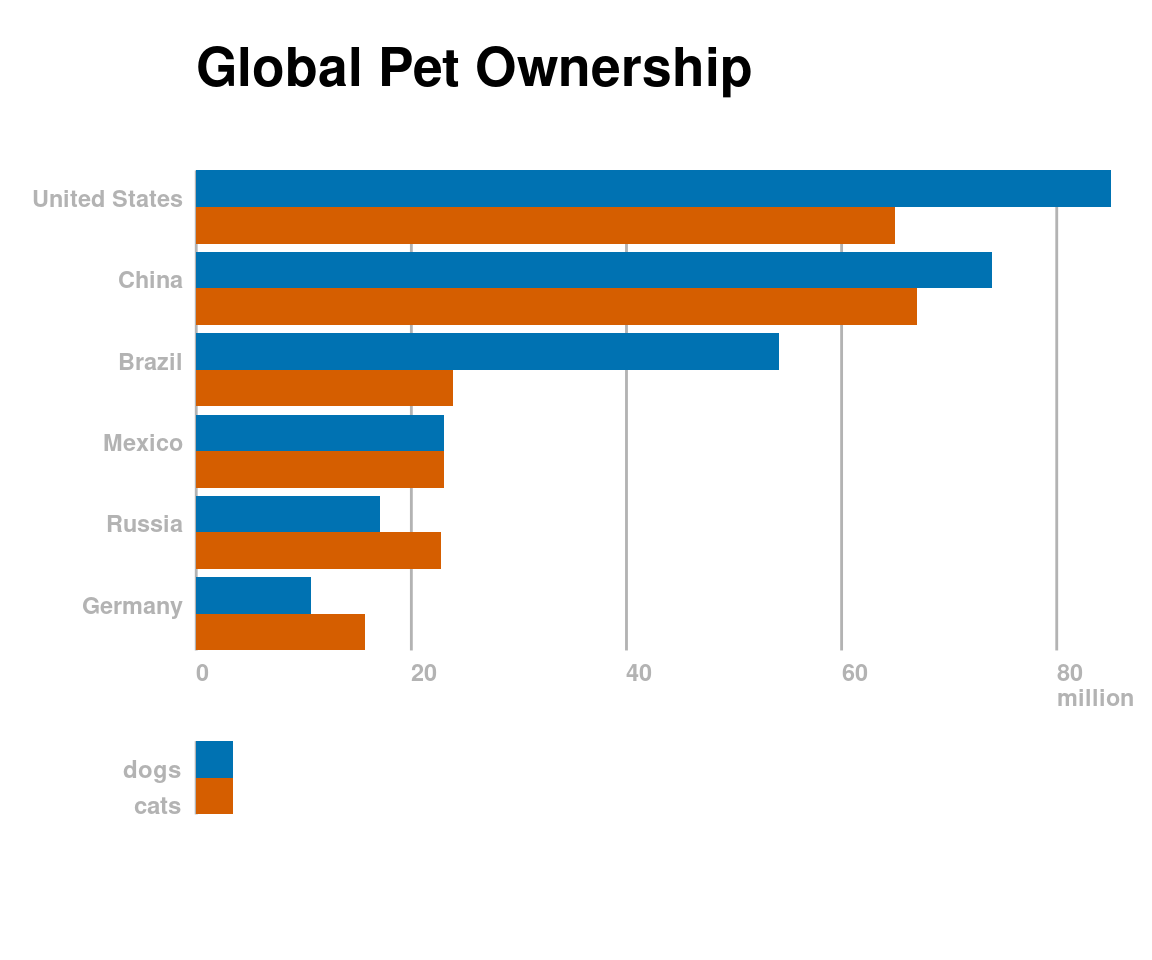
ggplot(pets) +
    geom_col(aes(x=millions, y=country, fill=pet), position="dodge") +
ggtitle("Global Pet Ownership")Hidden Mappings
in the
Grammar of Graphics
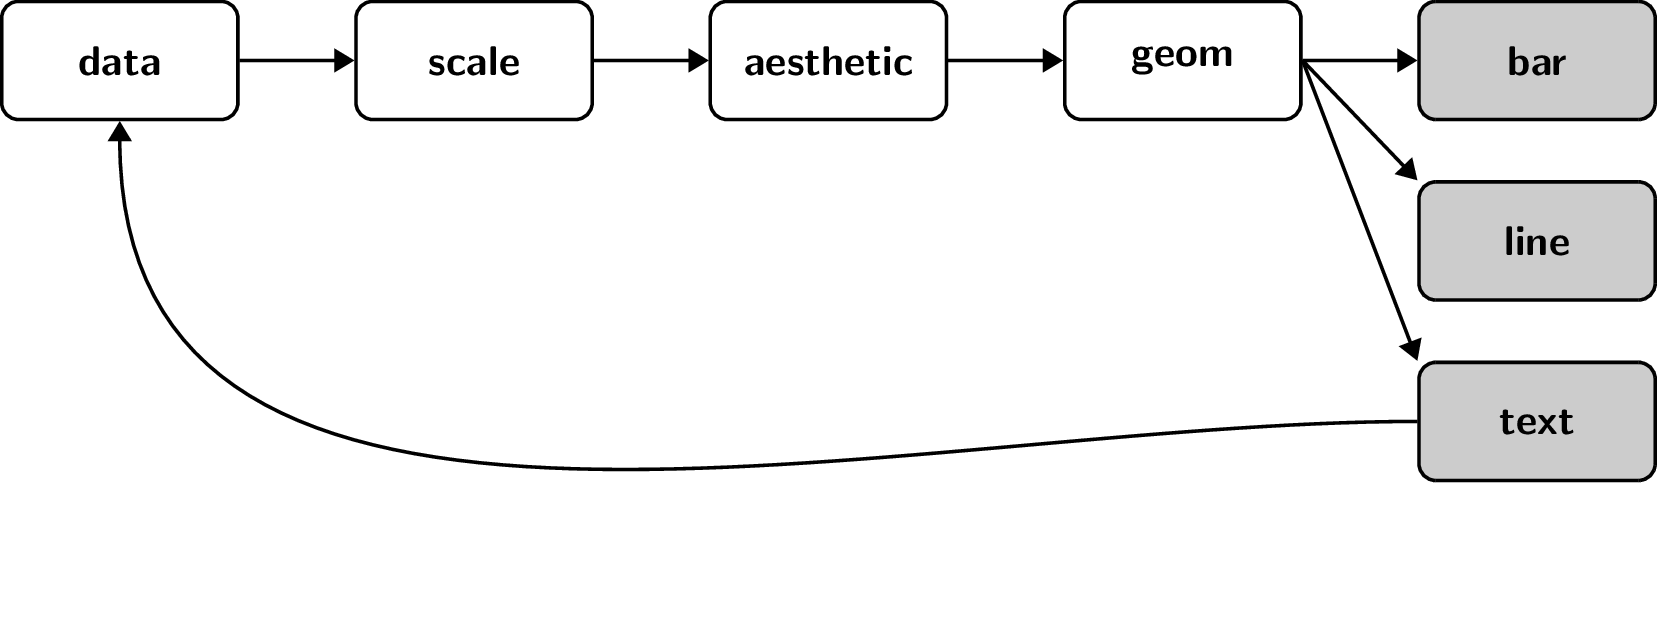
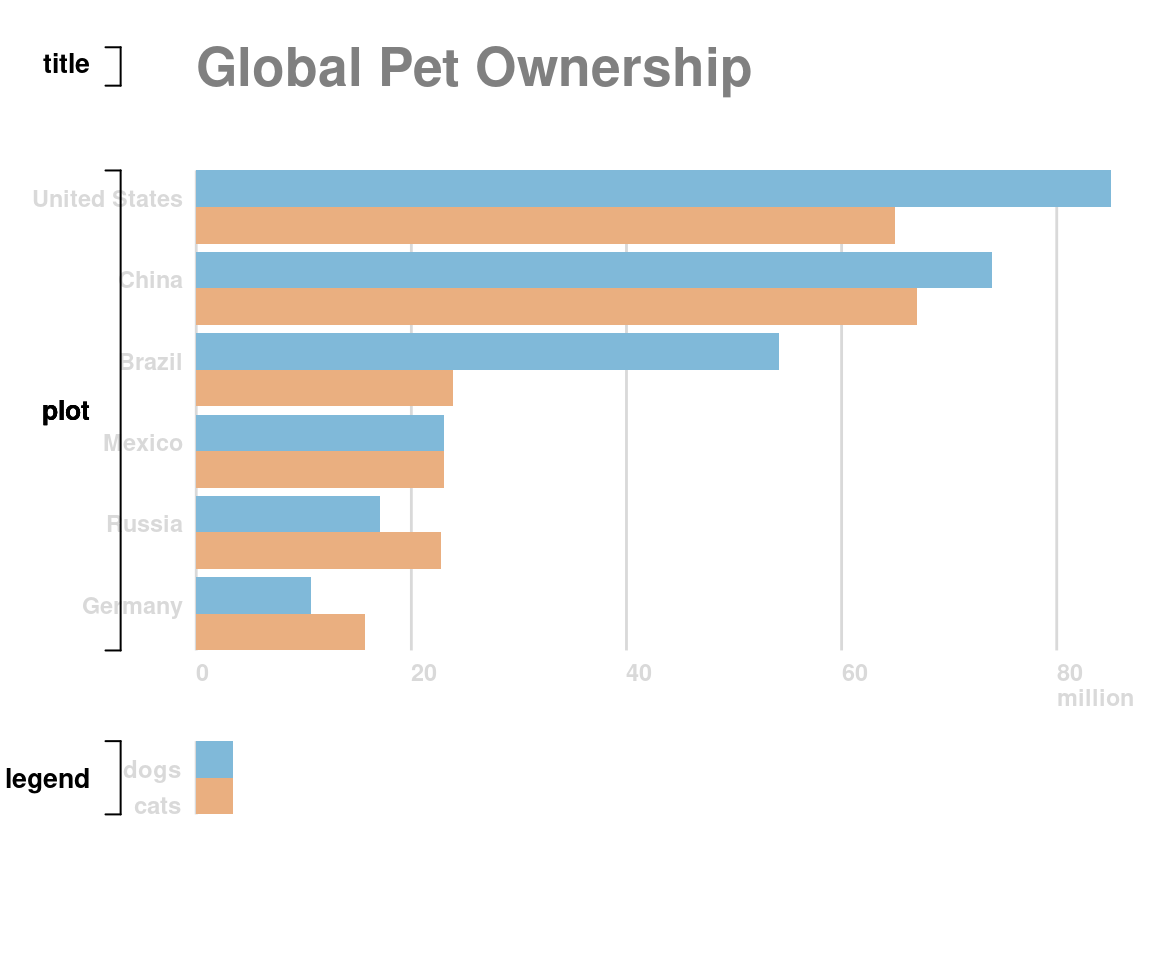
ggplot(pets) +
    geom_col(aes(x=millions, y=country, fill=pet), position="dodge") +
    scale_x_continuous(guide=guide_axis()) +
    scale_y_discrete(guide=guide_axis()) +
    scale_colour_discrete(guide=guide_legend()) +
    ggtitle("Global Pet Ownership")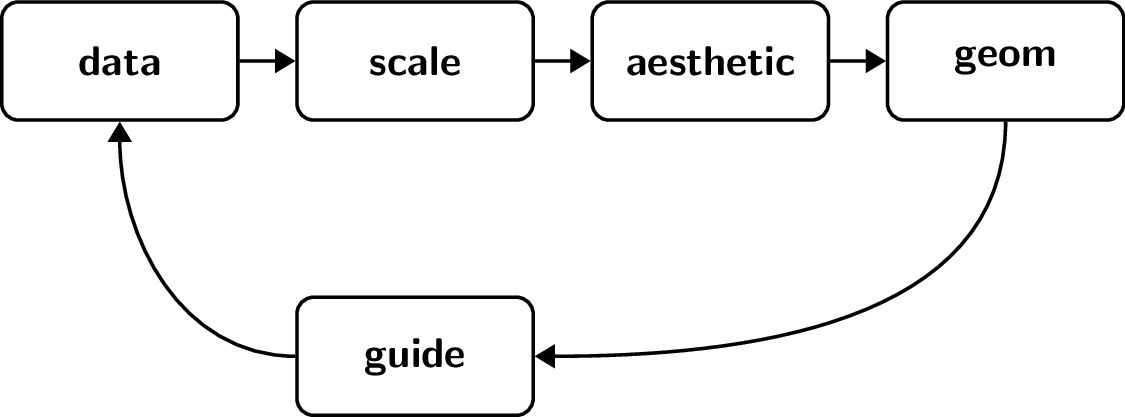
ggplot(pets) +
    geom_point(aes(x=millions, y=country, colour=pet)) +
    ggtitle("Global Pet Ownership")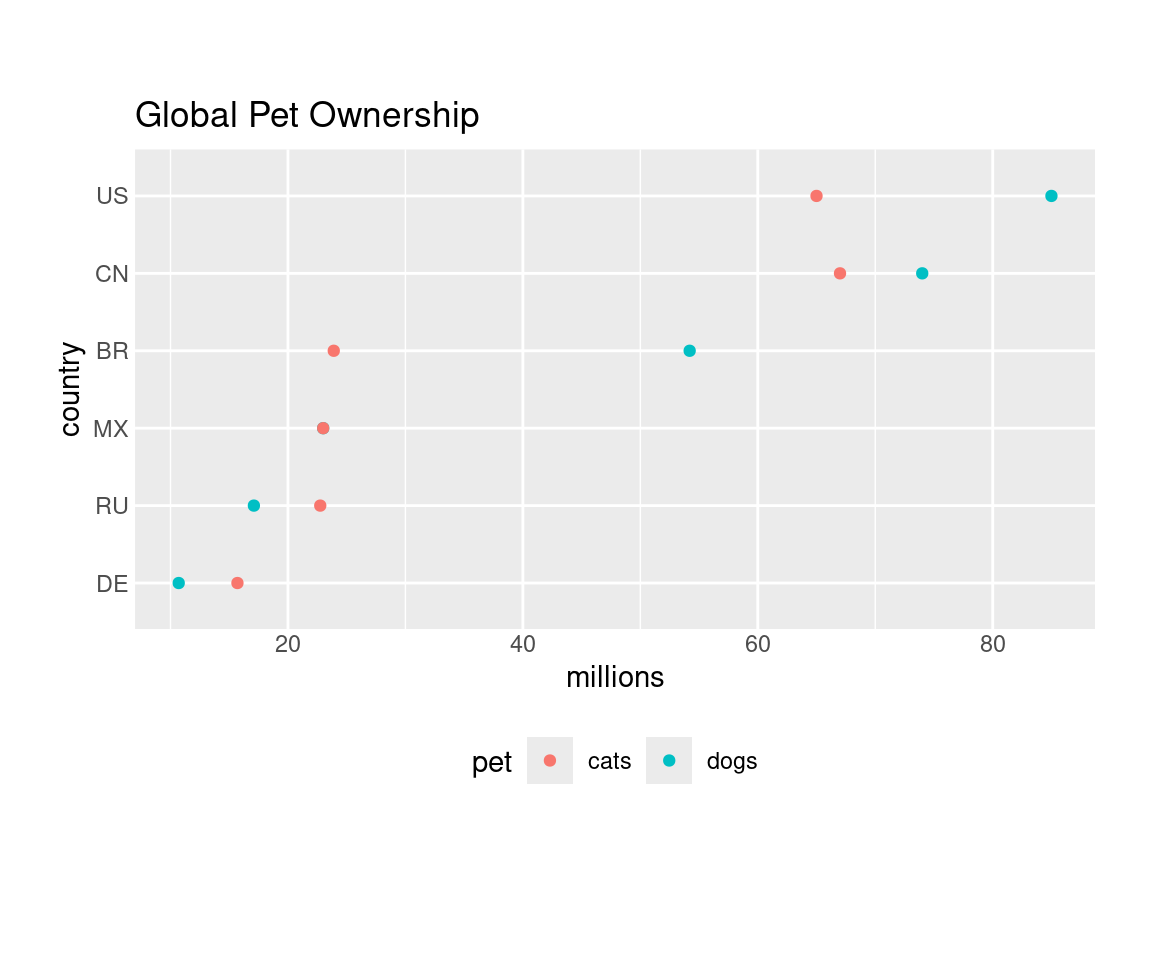
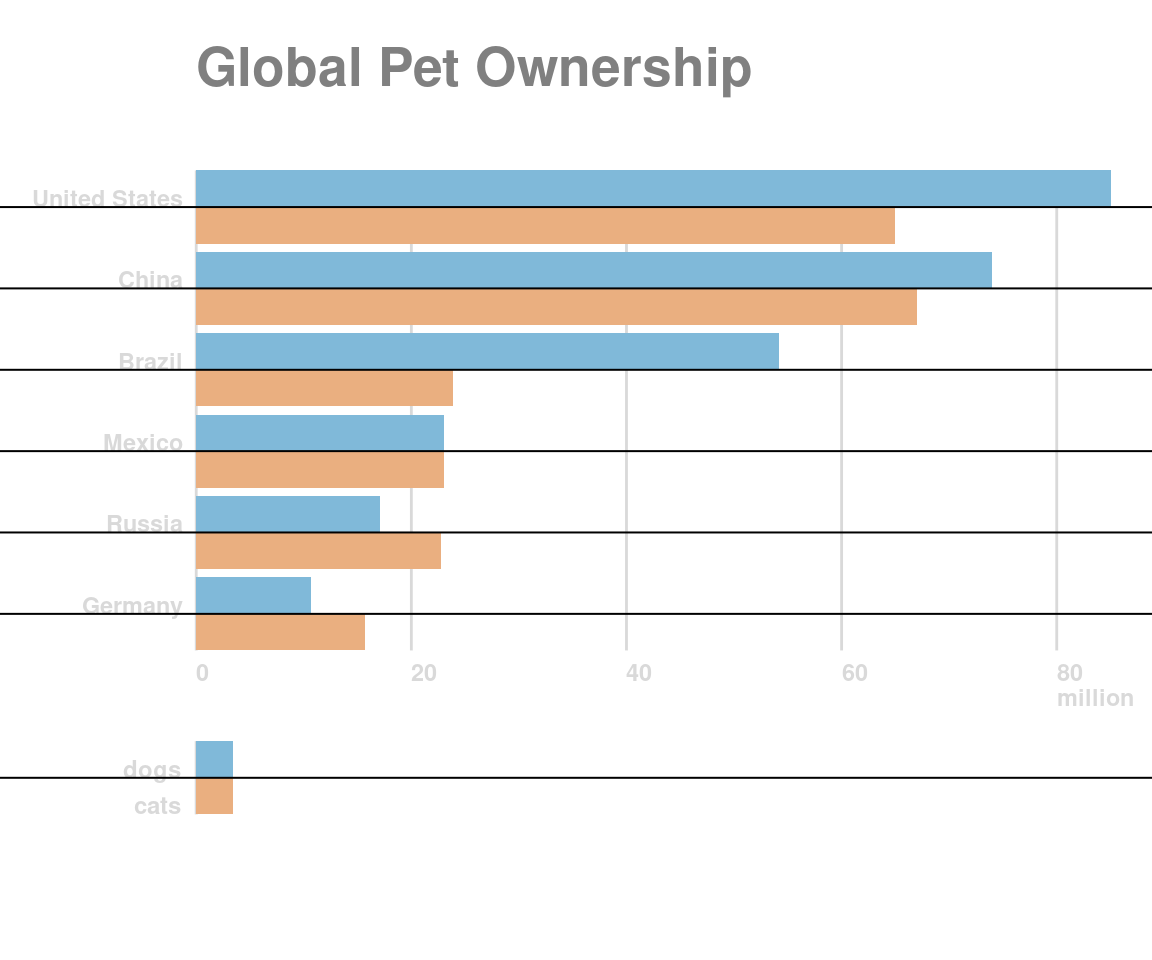
ggplot(pets) +
    geom_col(aes(x=millions, y=country, fill=pet), position="dodge")


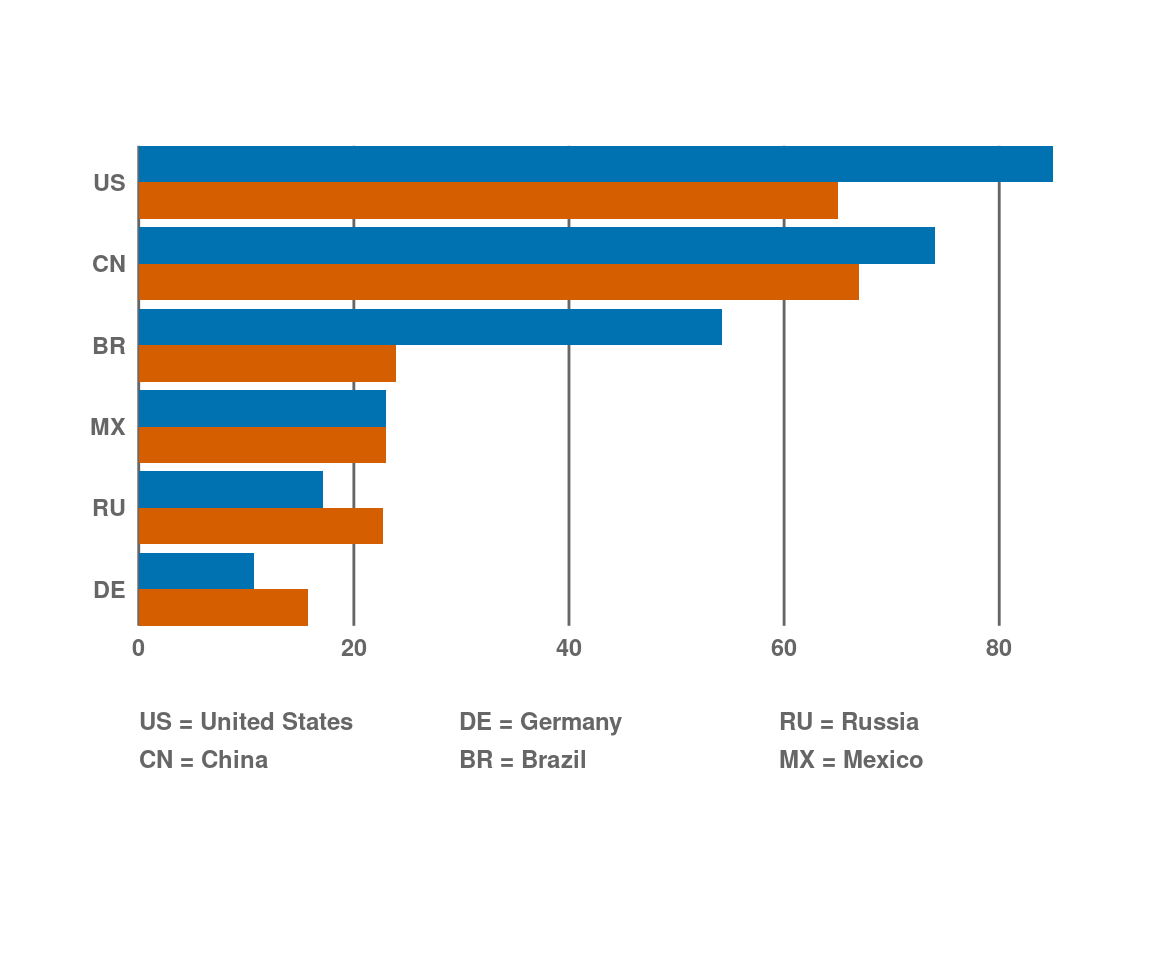
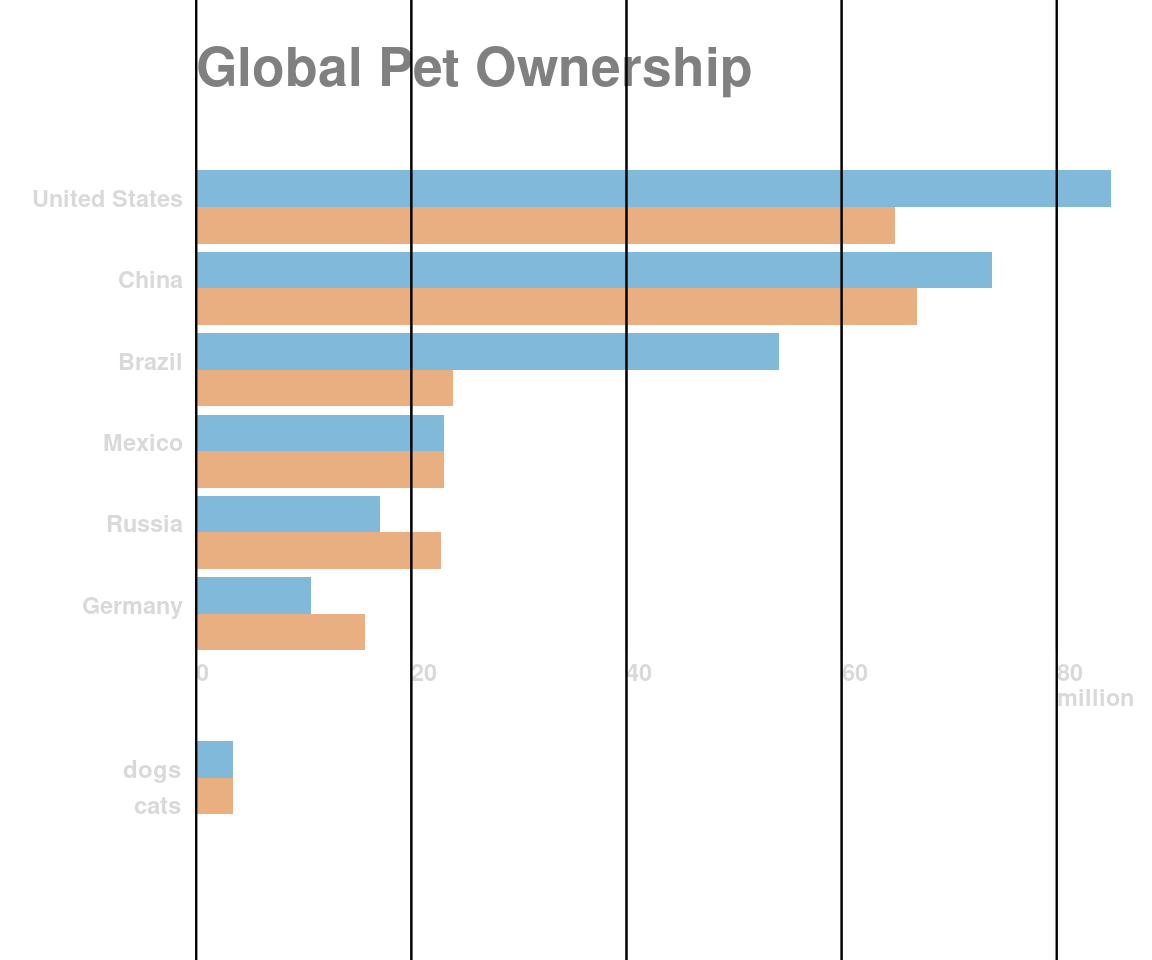
ggplot(pets) +
    geom_vline(aes(xintercept=x), data=data.frame(x=seq(0, 80, 20))) +
    geom_text(aes(label=x, x=x), y=-Inf, vjust=1,
              data=data.frame(x=seq(0, 80, 20))) +
    geom_col(aes(x=millions, y=country, fill=pet), position="dodge")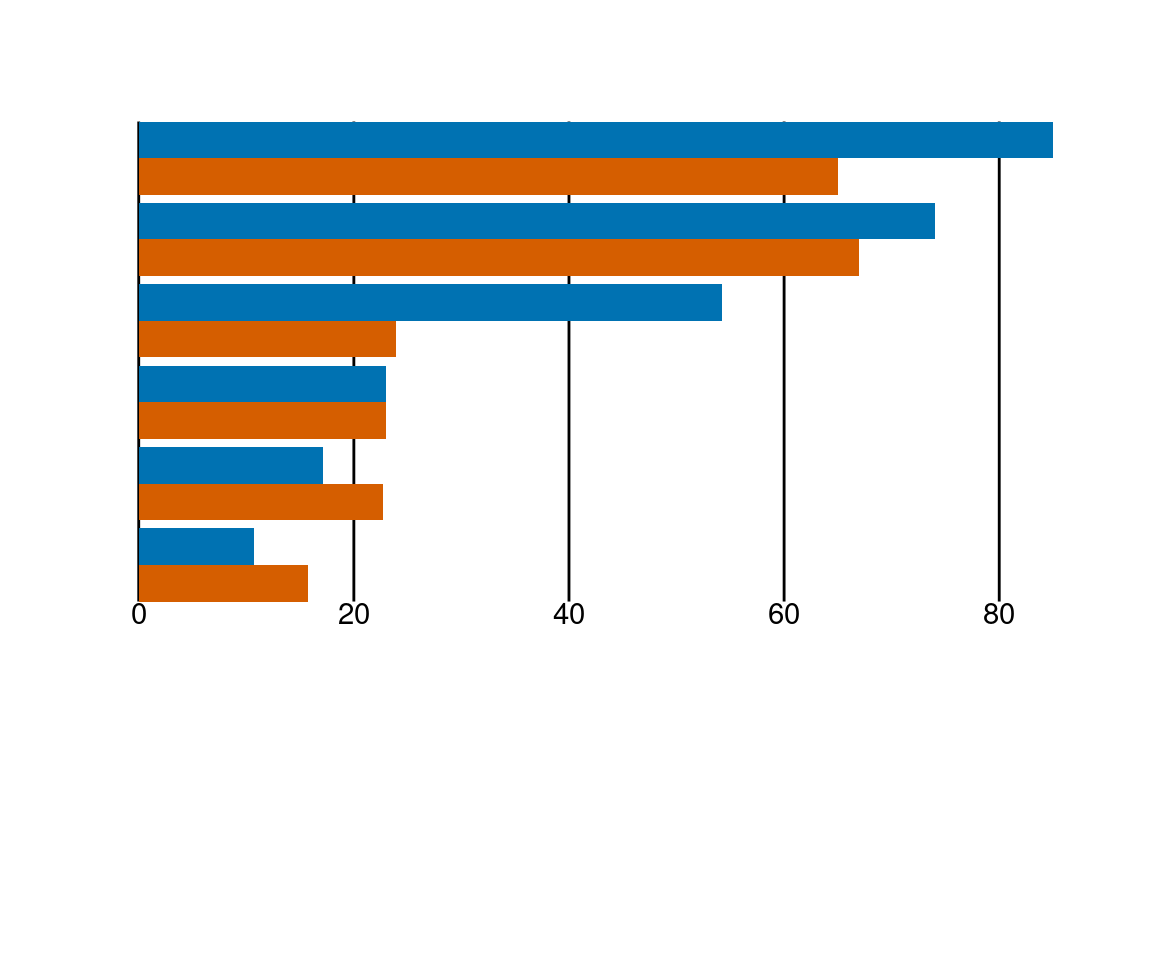

C.R.A.P. Design
C.R.A.P. Data Visualisation
Contrast

Contrast
Repetition

Alignment
Alignment
Alignment
Proximity

Proximity
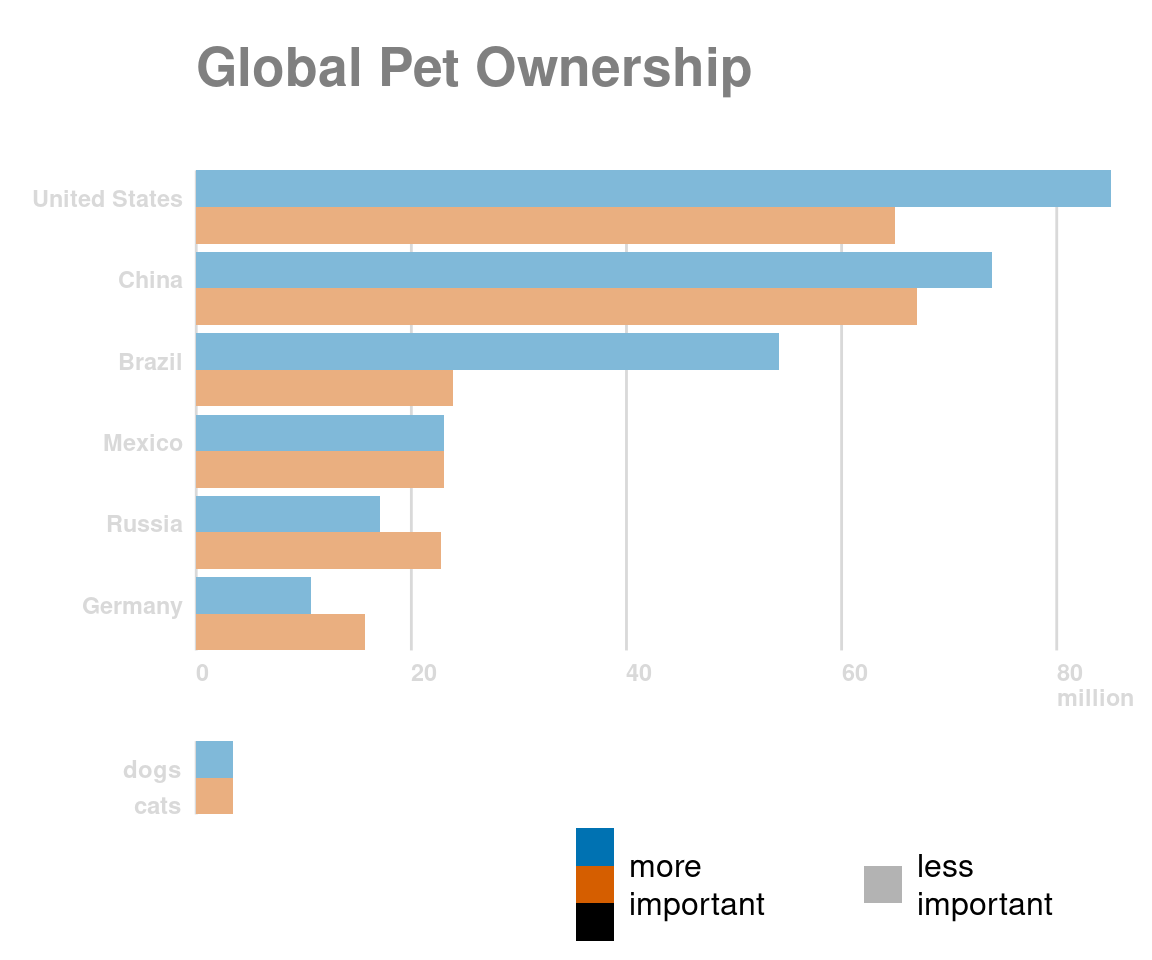
C.R.A.P. mappings

C.R.A.P. mappings
