     xyplot(x,
            data,
            allow.multiple = is.null(groups) || outer,
            outer = !is.null(groups),
            auto.key = FALSE,
            aspect = "fill",
            panel = lattice.getOption("panel.xyplot"),
            prepanel = NULL,
            scales = list(),
            strip = TRUE,
            groups = NULL,
            xlab,
            xlim,
            ylab,
            ylim,
            drop.unused.levels = lattice.getOption("drop.unused.levels"),
            ...,
Allow More Drawing
======================
```{r echo=FALSE, results="hide"}
svg("plot-draw.svg")
trellis.par.set(trellis.pars)
print(plot)
grid.rect(width=rep(.99, 3), height=rep(.99, 3),
gp=gpar(lty=c("solid", "solid", "dashed"),
lwd=c(7, 3, 3), col=c("black", "white"), fill=NA))
dev.off()
```
```{r eval=FALSE}
print(plot)
grid.rect()
```
Allow More Drawing
======================
An Example Plot
======================
What can I do with this plot **AFTER** it has been drawn ?
Remember the Drawing Context
======================
```{r eval=FALSE}
print(plot)
showViewport()
```
```{r echo=FALSE, results="hide"}
svg("plot-viewports.svg")
print(plot)
showViewport(depth=2, newpage=TRUE)
grid.remove("text", grep=TRUE, global=TRUE)
dev.off()
```
Allow Access to the Drawing Context
====================
```{r eval=FALSE}
print(plot)
downViewport("plot_01.panel.1.2.vp")
grid.text("Ferrari Dino", x=155, y=19.7, just="left", default="native")
```
```{r echo=FALSE, results="hide"}
gridsvg("plot-downvp.svg", res=96)
trellis.par.set(trellis.pars)
print(plot)
downViewport("plot_01.panel.2.1.vp")
grid.text("Ferrari Dino", x=155, y=19.7, just="left", default="native",
gp=gpar(col="red3"))
dev.off()
```
Allow Access to the Drawing Context
====================
+ →
Remember What was Drawn ====================== ```{r eval=FALSE} print(plot) showGrob() ``` ```{r echo=FALSE, results="hide"} svg("plot-grobs.svg") print(plot) mylabel <- function(grob, ...) { if (inherits(grob, "text")) { grid:::grobLabel(grob, ...) } else { grob } } showGrob(labelfun=mylabel, gp=gpar(col=NA, fill=rgb(1, 0, 0, 0.2))) dev.off() ``` Allow Access to What was Drawn ==================== ```{r eval=FALSE} print(plot) grid.edit("plot_01.xlab", label="Engine Displacement") ``` ```{r echo=FALSE, results="hide"} svg("plot-editgrob.svg") trellis.par.set(trellis.pars) print(plot) grid.edit("plot_01.xlab", label="Engine Displacement") showGrob(gPath="plot_01.xlab", gp=gpar(col=NA, fill=rgb(1, 0, 0, 0.2))) dev.off() ```Allow Access to What was Drawn ====================
→
Allow Labels and Structure ====================== ```{r eval=FALSE} grid.roundrect(gp=gpar(col=NA, fill=rgb(1,0,0,.5)), name="box") grid.text("Ferrari Dino", name="label") ``` ```{r echo=FALSE, results="hide"} gridsvg("labels.svg", width=4, height=1, res=96) grid.roundrect(gp=gpar(col=NA, fill=rgb(1,0,0,.5)), r=unit(.5, "in"), name="box") grid.text("Ferrari Dino", gp=gpar(cex=4), name="label") dev.off() ``` ```{r eval=FALSE} grid.ls() ``` ```{r echo=FALSE, fig.keep="none", comment=NA} grid.roundrect(gp=gpar(col=NA, fill=rgb(1,0,0,.5)), name="box") grid.text("Ferrari Dino", name="label") grid.ls() ``` Allow Labels and Structure ====================== ```{r eval=FALSE} gTree(children=gList(roundrectGrob(gp=gpar(col=NA, fill=rgb(1,0,0,.5)), name="box"), textGrob("Ferrari Dino", name="label")), name="boxedLabel") ``` ```{r echo=FALSE, results="hide"} gridsvg("labels.svg", width=4, height=1, res=96) grid.draw( gTree(children=gList(roundrectGrob(gp=gpar(col=NA, fill=rgb(1,0,0,.5)), r=unit(.5, "in"), name="box"), textGrob("Ferrari Dino", gp=gpar(cex=4), name="label")), name="boxedLabel") ) dev.off() ``` ```{r eval=FALSE} grid.ls() ``` ```{r echo=FALSE, fig.keep="none", comment=NA} grid.draw( gTree(children=gList(roundrectGrob(gp=gpar(col=NA, fill=rgb(1,0,0,.5)), name="box"), textGrob("Ferrari Dino", name="label")), name="boxedLabel") ) grid.ls() ``` The Example Plot ====================== Provide Labels and Structure ====================== ```{r eval=FALSE} print(plot) grid.ls(viewports=TRUE) ``` ```{r echo=FALSE, fig.keep="none", comment=NA} print(plot) temp <- grid.ls(viewports=TRUE, fullNames=TRUE, print=FALSE) cl <- class(temp) temp <- lapply(temp, "[", 1:10) temp <- lapply(temp, "[", !grepl("vpUpListing", temp$type)) class(temp) <- cl temp ``` Export Labels and Structure ================== Export Labels and Structure ================== R code ...library(gridSVG) print(plot) grid.export()SVG code ...
<svg>
  <rect id="plot_01.background.1.1"/>
  <g id="plot_01.toplevel.vp.1">
    <g id="plot_01.toplevel.vp::plot_01.xlab.vp.1">
      <text id="plot_01.xlab.1">
...
Export Labels and Structure
==========
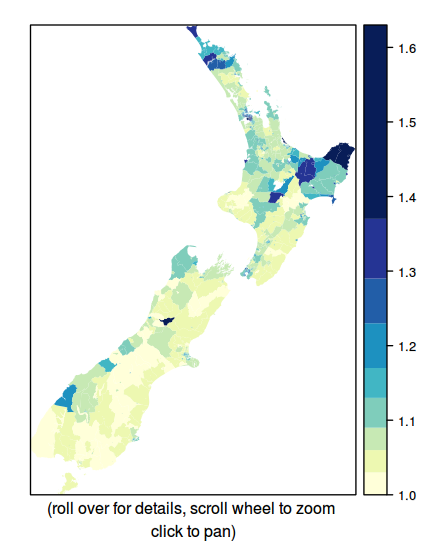
The Royal Society of New Zealand:
Languages in Aotearoa New Zealand
Export Labels and Structure
==========
```{r echo=FALSE, fig.keep="none", comment=NA}
textbox <- function(text, vp, bg="grey", col="black", label=text) {
grid.roundrect(width=stringWidth(text) + unit(4, "mm"),
height=unit(1.5, "lines"),
gp=gpar(col=NA, fill=bg),
vp=vp, name=label)
grid.text(text, gp=gpar(col=col), vp=vp)
}
gridsvg("diagram.svg", width=6, height=3)
pushViewport(viewport(layout=grid.layout(2, 4)))
pushViewport(viewport(layout.pos.row=2,
layout.pos.col=1,
name="21"))
upViewport()
pushViewport(viewport(layout.pos.row=2,
layout.pos.col=2,
name="22"))
upViewport()
pushViewport(viewport(layout.pos.row=2,
layout.pos.col=3,
name="23"))
upViewport()
pushViewport(viewport(layout.pos.row=2,
layout.pos.col=4,
name="24"))
upViewport()
pushViewport(viewport(layout.pos.row=1,
layout.pos.col=4,
name="14"))
upViewport()
textbox("grid", "21")
textbox("lattice", "22")
textbox("gridSVG", "23")
textbox("SVG", "24", "black", "white")
textbox("javascript", "14")
arrow <- arrow(type="closed", length=unit(3, "mm"), angle=15)
grid.segments(grobX("grid", 0), grobY("grid", 0),
grobX("lattice", 180), grobY("lattice", 180),
arrow=arrow, gp=gpar(fill="black"))
grid.segments(grobX("lattice", 0), grobY("lattice", 0),
grobX("gridSVG", 180), grobY("gridSVG", 180),
arrow=arrow, gp=gpar(fill="black"))
grid.segments(grobX("gridSVG", 0), grobY("gridSVG", 0),
grobX("SVG", 180), grobY("SVG", 180),
arrow=arrow, gp=gpar(fill="black"))
grid.segments(grobX("javascript", 270), grobY("javascript", 270),
grobX("SVG", 90), grobY("SVG", 90),
arrow=arrow, gp=gpar(fill="black"))
dev.off()
```
Export Labels and Structure
==========
R code ...
pushViewport(viewport(name="viewport"))
grid.polygon("ID:1")
grid.polygon("ID:2")
...
SVG code ...
<svg>
  <g id="viewport">
    <polygon id="ID:1" .../>
    <polygon id="ID:2" .../>
...
Javascript code ...
svgRoot = root.getElementById("viewport");
...
Don't be a Dead End
==========
The Royal Society of New Zealand:
Languages in Aotearoa New Zealand (**original**)
 Don't be a Dead End
==========
The Royal Society of New Zealand:
Languages in Aotearoa New Zealand (**recycled**)
Don't be a Dead End
==========
```{r echo=FALSE, fig.keep="none", comment=NA}
gridsvg("diagram-2.svg", width=6, height=3)
pushViewport(viewport(layout=grid.layout(2, 6)))
pushViewport(viewport(layout.pos.row=2,
layout.pos.col=1,
name="21"))
upViewport()
pushViewport(viewport(layout.pos.row=2,
layout.pos.col=2,
name="22"))
upViewport()
pushViewport(viewport(layout.pos.row=2,
layout.pos.col=3,
name="23"))
upViewport()
pushViewport(viewport(layout.pos.row=2,
layout.pos.col=4,
name="24"))
upViewport()
pushViewport(viewport(layout.pos.row=2,
layout.pos.col=5,
name="25"))
upViewport()
pushViewport(viewport(layout.pos.row=2,
layout.pos.col=6,
name="26"))
upViewport()
pushViewport(viewport(layout.pos.row=1,
layout.pos.col=4,
name="14"))
upViewport()
textbox("grid", "21")
textbox("lattice", "22")
textbox("gridSVG", "23")
textbox("SVG", "24", "black", "white")
textbox("javascript", "14")
textbox("XML", "25")
textbox("SVG", "26", "black", "white", label="SVG2")
arrow <- arrow(type="closed", length=unit(3, "mm"), angle=15)
grid.segments(grobX("grid", 0), grobY("grid", 0),
grobX("lattice", 180), grobY("lattice", 180),
arrow=arrow, gp=gpar(fill="black"))
grid.segments(grobX("lattice", 0), grobY("lattice", 0),
grobX("gridSVG", 180), grobY("gridSVG", 180),
arrow=arrow, gp=gpar(fill="black"))
grid.segments(grobX("gridSVG", 0), grobY("gridSVG", 0),
grobX("SVG", 180), grobY("SVG", 180),
arrow=arrow, gp=gpar(fill="black"))
grid.segments(grobX("javascript", 270), grobY("javascript", 270),
grobX("SVG", 90), grobY("SVG", 90),
arrow=arrow, gp=gpar(fill="black"))
grid.segments(grobX("SVG", 0), grobY("SVG", 0),
grobX("XML", 180), grobY("XML", 180),
arrow=arrow, gp=gpar(fill="black"))
grid.segments(grobX("XML", 0), grobY("XML", 0),
grobX("SVG2", 180), grobY("SVG2", 180),
arrow=arrow, gp=gpar(fill="black"))
dev.off()
```
Summary
=======
Don't be a Dead End
- grid
- Allow more drawing
- Record the drawing context
- Allow access to the drawing context
- Record what was drawn
- Allow access to what was drawn
- Allow labels and structure
- lattice
- Provide a naming scheme
- Provide structure
- gridSVG
- Export labels and structure
Acknowledgements
=========
- The plot with lots of extra drawing was adapted from
Felgate, Bickler, and Murrell (2013)
"Estimating parent population of pottery vessels from a sample of fragments:
a case study from inter-tidal surface collections, Roviana Lagoon, Solomon Islands",
Journal of Archaeological Science, 40 (2013) 1319-1328.
- The raster map plot used NASA light data from Steve Mosher and
a Google Map tile (copyright 2011 Google, Map Data and
copyright 2011 Tele Atlas).
- The forest plot was generated using the 'metaplot' package
by Murrell, Scott, and Lu
- The map of Multilingualism in New Zealand was created by
Paul Behrens for the
Royal Society of New Zealand
Don't be a Dead End
==========
The Royal Society of New Zealand:
Languages in Aotearoa New Zealand (**recycled**)
Don't be a Dead End
==========
```{r echo=FALSE, fig.keep="none", comment=NA}
gridsvg("diagram-2.svg", width=6, height=3)
pushViewport(viewport(layout=grid.layout(2, 6)))
pushViewport(viewport(layout.pos.row=2,
layout.pos.col=1,
name="21"))
upViewport()
pushViewport(viewport(layout.pos.row=2,
layout.pos.col=2,
name="22"))
upViewport()
pushViewport(viewport(layout.pos.row=2,
layout.pos.col=3,
name="23"))
upViewport()
pushViewport(viewport(layout.pos.row=2,
layout.pos.col=4,
name="24"))
upViewport()
pushViewport(viewport(layout.pos.row=2,
layout.pos.col=5,
name="25"))
upViewport()
pushViewport(viewport(layout.pos.row=2,
layout.pos.col=6,
name="26"))
upViewport()
pushViewport(viewport(layout.pos.row=1,
layout.pos.col=4,
name="14"))
upViewport()
textbox("grid", "21")
textbox("lattice", "22")
textbox("gridSVG", "23")
textbox("SVG", "24", "black", "white")
textbox("javascript", "14")
textbox("XML", "25")
textbox("SVG", "26", "black", "white", label="SVG2")
arrow <- arrow(type="closed", length=unit(3, "mm"), angle=15)
grid.segments(grobX("grid", 0), grobY("grid", 0),
grobX("lattice", 180), grobY("lattice", 180),
arrow=arrow, gp=gpar(fill="black"))
grid.segments(grobX("lattice", 0), grobY("lattice", 0),
grobX("gridSVG", 180), grobY("gridSVG", 180),
arrow=arrow, gp=gpar(fill="black"))
grid.segments(grobX("gridSVG", 0), grobY("gridSVG", 0),
grobX("SVG", 180), grobY("SVG", 180),
arrow=arrow, gp=gpar(fill="black"))
grid.segments(grobX("javascript", 270), grobY("javascript", 270),
grobX("SVG", 90), grobY("SVG", 90),
arrow=arrow, gp=gpar(fill="black"))
grid.segments(grobX("SVG", 0), grobY("SVG", 0),
grobX("XML", 180), grobY("XML", 180),
arrow=arrow, gp=gpar(fill="black"))
grid.segments(grobX("XML", 0), grobY("XML", 0),
grobX("SVG2", 180), grobY("SVG2", 180),
arrow=arrow, gp=gpar(fill="black"))
dev.off()
```
Summary
=======
Don't be a Dead End
- grid
- Allow more drawing
- Record the drawing context
- Allow access to the drawing context
- Record what was drawn
- Allow access to what was drawn
- Allow labels and structure
- lattice
- Provide a naming scheme
- Provide structure
- gridSVG
- Export labels and structure
Acknowledgements
=========
- The plot with lots of extra drawing was adapted from
Felgate, Bickler, and Murrell (2013)
"Estimating parent population of pottery vessels from a sample of fragments:
a case study from inter-tidal surface collections, Roviana Lagoon, Solomon Islands",
Journal of Archaeological Science, 40 (2013) 1319-1328.
- The raster map plot used NASA light data from Steve Mosher and
a Google Map tile (copyright 2011 Google, Map Data and
copyright 2011 Tele Atlas).
- The forest plot was generated using the 'metaplot' package
by Murrell, Scott, and Lu
- The map of Multilingualism in New Zealand was created by
Paul Behrens for the
Royal Society of New Zealand