Don't be a Dead End
The Royal Society of New Zealand: Languages in Aotearoa New Zealand (original)
library(lattice)
plot <- xyplot(mpg ~ disp | trans, data=mtcars)What can I do with this plot AFTER it has been drawn ?
     xyplot(x,
            data,
            allow.multiple = is.null(groups) || outer,
            outer = !is.null(groups),
            auto.key = FALSE,
            aspect = "fill",
            panel = lattice.getOption("panel.xyplot"),
            prepanel = NULL,
            scales = list(),
            strip = TRUE,
            groups = NULL,
            xlab,
            xlim,
            ylab,
            ylim,
            drop.unused.levels = lattice.getOption("drop.unused.levels"),
            ...,
print(plot)
grid.rect()What can I do with this plot AFTER it has been drawn ?
print(plot)
showViewport()print(plot)
downViewport("plot_01.panel.1.2.vp")
grid.text("Ferrari Dino", x=155, y=19.7, just="left", default="native")
+ →
print(plot)
showGrob()print(plot)
grid.edit("plot_01.xlab", label="Engine Displacement")
→
grid.roundrect(gp=gpar(col=NA, fill=rgb(1,0,0,.5)), name="box")
grid.text("Ferrari Dino", name="label")
grid.ls()box
labelgTree(children=gList(roundrectGrob(gp=gpar(col=NA, fill=rgb(1,0,0,.5)),
name="box"),
textGrob("Ferrari Dino", name="label")),
name="boxedLabel")
grid.ls()boxedLabel
box
labelprint(plot)
grid.ls(viewports=TRUE)viewport[ROOT]
rect[plot_01.background]
viewport[plot_01.toplevel.vp]
viewport[plot_01.xlab.vp]
text[plot_01.xlab]
viewport[plot_01.ylab.vp]
text[plot_01.ylab]
viewport[plot_01.figure.vp]R code ...
library(gridSVG)
print(plot)
grid.export()
SVG code ...
<svg>
  <rect id="plot_01.background.1.1"/>
  <g id="plot_01.toplevel.vp.1">
    <g id="plot_01.toplevel.vp::plot_01.xlab.vp.1">
      <text id="plot_01.xlab.1">
...
The Royal Society of New Zealand: Languages in Aotearoa New Zealand
R code ...
pushViewport(viewport(name="viewport"))
grid.polygon("ID:1")
grid.polygon("ID:2")
...
SVG code ...
<svg>
  <g id="viewport">
    <polygon id="ID:1" .../>
    <polygon id="ID:2" .../>
...
Javascript code ...
svgRoot = root.getElementById("viewport");
...
The Royal Society of New Zealand: Languages in Aotearoa New Zealand (recycled)
Don't be a Dead End
The plot with lots of extra drawing was adapted from Felgate, Bickler, and Murrell (2013) "Estimating parent population of pottery vessels from a sample of fragments: a case study from inter-tidal surface collections, Roviana Lagoon, Solomon Islands", Journal of Archaeological Science, 40 (2013) 1319-1328.
The raster map plot used NASA light data from Steve Mosher and a Google Map tile (copyright 2011 Google, Map Data and copyright 2011 Tele Atlas).
The forest plot was generated using the 'metaplot' package by Murrell, Scott, and Lu
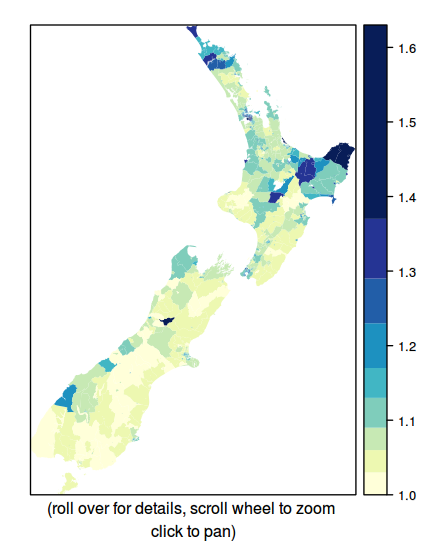
The map of Multilingualism in New Zealand was created by Paul Behrens for the Royal Society of New Zealand