PNG Graphics
png("plot.png")
print(latticePlot)
dev.off()
Problem Statement: Generate an R plot for the Web
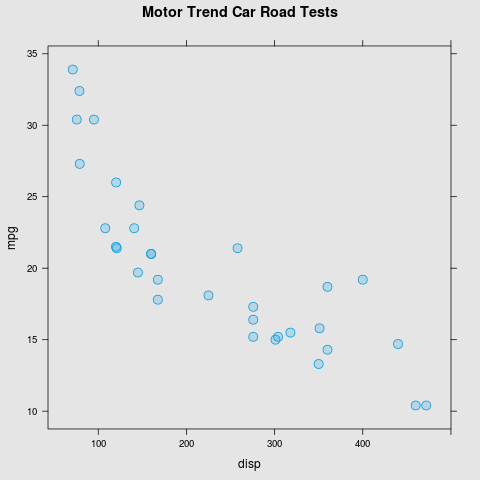
library(lattice)latticePlot <- xyplot(mpg ~ disp, mtcars, pch=21, cex=1.5,
main="Motor Trend Car Road Tests",
col=blue, fill=thrublue,
par.settings=list(background=list(col="grey90")))png("plot.png")
print(latticePlot)
dev.off()
<img src="plot.png"/>
svg("plot.svg")
print(latticePlot)
dev.off()

<img src="plot.svg"/>
library(gridSVG)gridsvg("gridsvg-plot.svg")
print(latticePlot)
dev.off()
<img src="gridsvg-plot.svg"/>

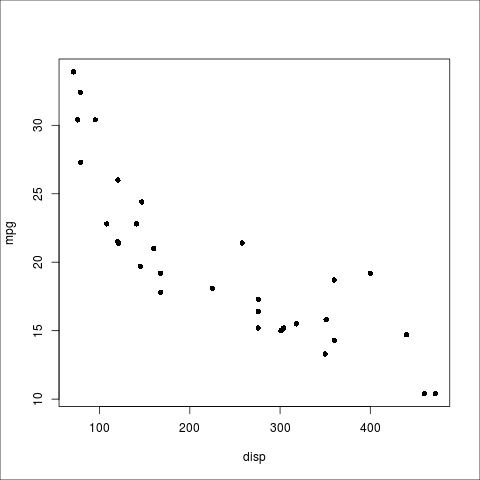
png("graphics.png")
plot(mpg ~ disp, mtcars)
dev.off()
gridsvg("graphics.svg")
plot(mpg ~ disp, mtcars)
dev.off()gridsvg("gridsvg-plot.svg")
print(latticePlot)
dev.off()
A grid-based plot ...
print(latticePlot)
grid.ls()
plot_01.background
plot_01.main
plot_01.xlab
plot_01.ylab
plot_01.ticks.top.panel.1.1
plot_01.ticks.left.panel.1.1
plot_01.ticklabels.left.panel.1.1
plot_01.ticks.bottom.panel.1.1
plot_01.ticklabels.bottom.panel.1.1
plot_01.ticks.right.panel.1.1
plot_01.xyplot.points.panel.1.1
plot_01.border.panel.1.1gridsvg("grid-edit.svg")
print(latticePlot)
grid.edit("lab", grep=TRUE, global=TRUE, gp=gpar(col="grey60"))
grid.remove("top|right", grep=TRUE, global=TRUE)
dev.off()
<img src="gridsvg-plot.svg"/>
gridsvg("tooltip.svg")
print(latticePlot)
grid.garnish("points", grep=TRUE, group=FALSE,
             title=paste("x =", mtcars$disp, " y =", mtcars$mpg))
dev.off()
gridsvg("hyperlink.svg")
print(latticePlot)
grid.hyperlink("plot_01.main", href="mtcars.html")
dev.off()
gridsvg("animate.svg")
print(latticePlot)
grid.animate("plot_01.xyplot.points.panel.1.1", group=FALSE,
             "stroke-opacity"=0:1,
             "fill-opacity"=c(0, .2),
             duration=mtcars$mpg)
dev.off()
gridsvg("gradient-demo.svg")
grid.circle(r=.4, name="circ")
gradient <- radialGradient(c("white", "blue", "black"), fx=.3, fy=.7)
grid.gradientFill("circ", gradient)
dev.off()gridsvg("gradient.svg")
print(latticePlot)
registerGradientFill("specular", gradient)
grid.gradientFill("points", grep=TRUE, group=FALSE,
label=rep("specular", nrow(mtcars)))
dev.off()
gridsvg("pattern-demo.svg")
grid.circle(r=.4, gp=gpar(fill="grey"))
dev.off()barplot <- barchart(table(mtcars$gear),
par.settings=list(background=list(col="grey90")))
gridsvg("pattern.svg")
print(barplot)
pattern <- pattern(circleGrob(r=.4, gp=gpar(fill="grey")),
                   width=.05, height=.05)
registerPatternFill("circles", pattern)
grid.patternFill("rect", grep=TRUE, group=FALSE,
                  label=rep("circles", 3))
dev.off()
gridsvg("filter.svg")
print(latticePlot)
blur <- filterEffect(feGaussianBlur(sd=1))
grid.filter("main|lab|tick|border", grep=TRUE, global=TRUE, blur)
dev.off()
circles <- circleGrob(r=c(.45, .2),
gp=gpar(col=NA, fill=c("grey", "white")))gridsvg("plot-clip.svg")
cp <- clipPath(circles)
pushClipPath(cp)
print(latticePlot, newpage=FALSE)
dev.off()
gridsvg("plot-masked.svg")
mask <- mask(circles)
pushMask(mask)
print(latticePlot, newpage=FALSE)
dev.off()
gridsvg("plot-js.svg")
print(latticePlot, newpage=FALSE)
grid.garnish("points", grep=TRUE, group=FALSE,
             onclick=paste("alert('x =", mtcars$disp,
                           "y =", mtcars$mpg, "')"))
dev.off()
gridsvg("leaf.svg")
library(grImport)
leaf <- readPicture("fall12.xml")
grid.picture(leaf)
dev.off()gridsvg("barchart-silly.svg")
print(barplot)
grid.patternFill("rect", grep=TRUE, group=FALSE,
label=rep("leaf", 3))
dev.off()
Web publishing (HTML) is hot
SVG is cool
gridSVG shows potential
bringing SVG goodness to R
bringing R goodness to SVG
Many of the new features in 'gridSVG' were implemented by Simon Potter as part of his Masters Thesis
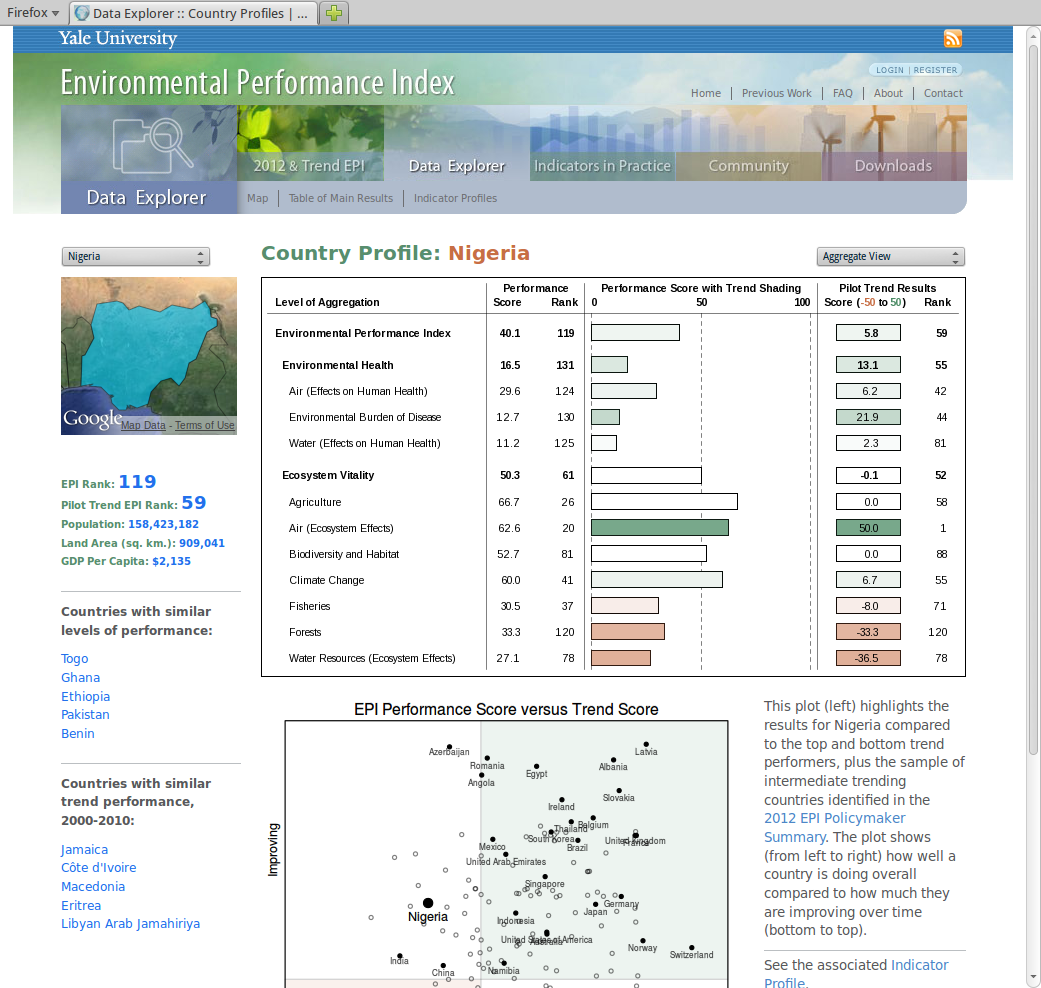
The hyperlinked scatterplot example was from Yale's Environmental Performance Index
The "Price Kaleidoscope" and "linked map" examples were produced by David Banks as part of his BSc Honours Project
The 'lattice' plot with checkboxes and tooltips was produced by David Banks as part of his Masters Project
The leaf image was created by OpenClipArt user Aungkarn Sugcharoun