HOME

ISR-15: Dynamic Content for 2017 Int. Statist. Review Paper

"Accessible Conceptions of Statistical Inference: Pulling ourselves up by the bootstraps"

[Wild, C.J., Pfannkuch, M., Regan, M., and Parsonage, R. (2017). Accessible conceptions of statistical inference: Pulling ourselves up by the bootstraps. Statistical Review, 85(1), 84–107. Online: http://onlinelibrary.wiley.com/doi/10.1111/insr.12117/pdf]

Being built slowly ... More dynamic content to be added

An early version of the paper is here.

The best way in to understanding the visualisation-based approaches to teaching inferential concepts that the paper and the VIT software facilitate is to watch some of the Teaching Examples linked from this page beginning with this one. These are movies of roughly 5 minutes duration from my MOOC "Data to Insight" (from Weeks 5-7).

In addition to the teaching examples, there are some links to some Narrated movies for teachers and animated Gifs. The narrated movies explain the logic of the software from a teaching viewpoint. The animated Gifs are mainly intended to give a quick idea of how the graphic metaphors change between application situations. Some are useful in their own right (e.g. I use some of them in the "Data to Insight" teaching examples).

Note: VIT is desktop software. VITonline is here.

Table of Contents

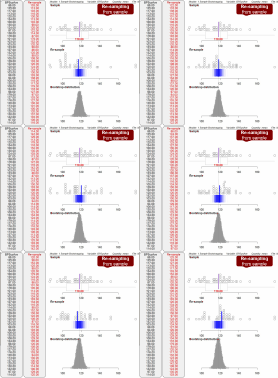
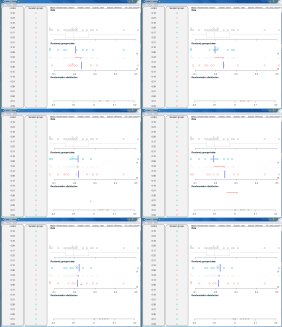
BOOTSTRAP RE-SAMPLING VS SAMPLING VARIATION

Figure 1: Bootstrap re-sampling variation cf. sampling variation (for mean)


Animated Gifs
(50%), (100%)

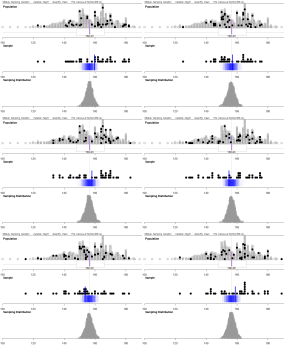
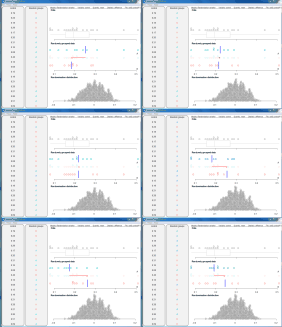
SAMPLING VARIATION

Teaching Examples

SV of mean (Movie "Random Error: Part 1" from "Data to Insight")

SV of proportion (Movie "Random Error: Part 2" from "Data to Insight")

Figure 2: Sampling variation in a mean

Animated Gif

Narrated movie for teachers

Sampling Error (for mean, animated gif not in paper) Animated Gif: 100%

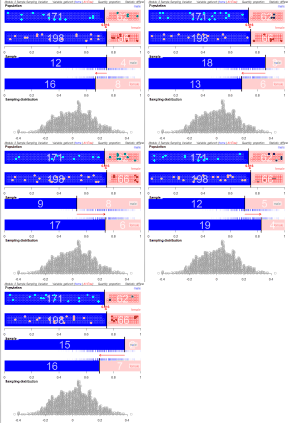
Figure 3: Other examples of sampling variation

(a) Difference in Means:

Animated Gif

Narrated movie for teachers

( ) Single Proportion:

Animated Gif; Teaching Example

Narrated movie for teachers
(b) Difference in proportions:

Animated Gif

Narrated movie for teachers
(c) Ratio of IQRs:

Animated Gif

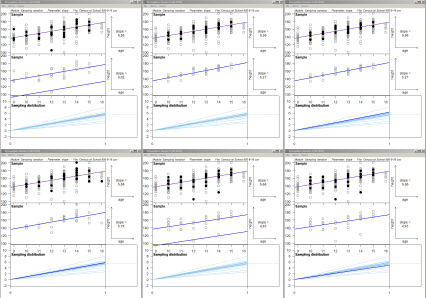
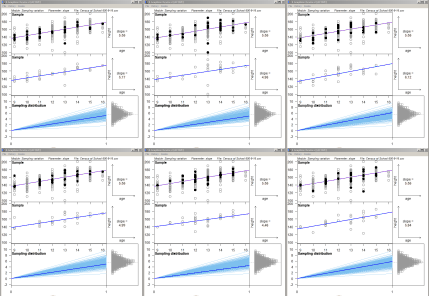
(d) Regression slopes:

Animated Gif


Animated Gif

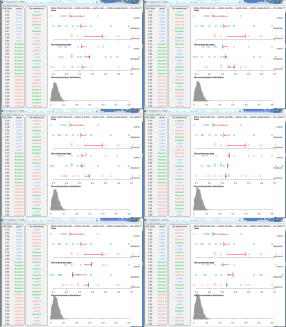
BOOTSTRAP CONFIDENCE INTERVALS

Teaching Example


"Bootstrap confidence intervals" (Movie from "Data to Insight")

Nature of re-sampling


Figure 5: Boostrap confidence interval formation

Animated Gifs (click thumbnails):


Single mean


Regression slope

Not shown in paper: Confidence interval coverage


Single mean

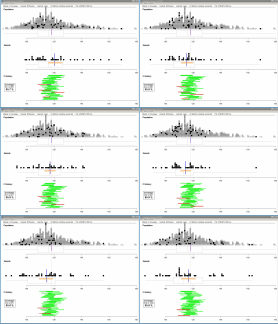
RANDOMISATION VARIATION

Teaching Example


"Randomisation variation" (Movie from "Data to Insight")

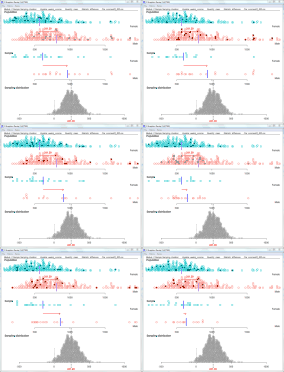
Figure 6: Randomisation variation in a difference of means

Animated Gifs (click thumbnails)
Difference in means


Difference in proportions

RANDOMISATION TEST

Teaching Examples


"Randomisation-test for means" (Movie from "Data to Insight")

"Proportions and multiple groups" (Movie from "Data to Insight")

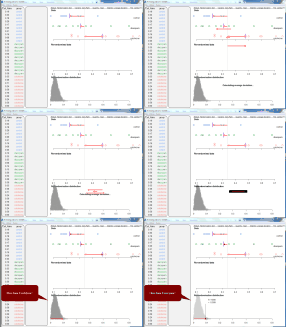
Figure 7: Randomisation test (I): Constructing re-randomisation distribution

Animated Gifs (click thumbnails):


Difference between 2 means


Differences between 3 means

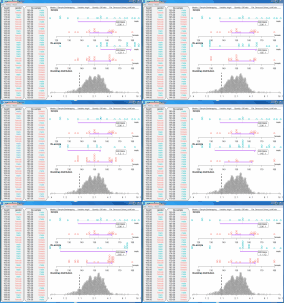
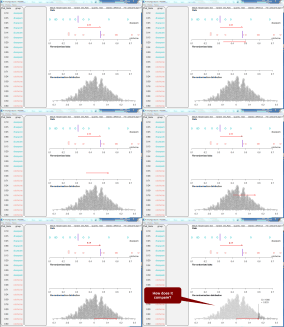
Figure 8: Randomisation test (II): How does it compare?

Animated Gifs (click thumbnails):


Differences between 2 means


Difference between 3 means