Animations of Sampling Variation
These are the animations referred to in the paper, "Towards more accessible conceptions of Statistical Inference" by Chris Wild, Maxine Pfannkuch, Matt Regan and Nicholas Horton published in 2011 in the Journal of the Royal Statistical Society, Series A (Vol 174, pp 247-295) read to the Royal Statistical Society on World Statistics Day, 20 October 2010.They were also used in Chris Wild's Keynote Address at USCOTS 2009 (the 3rd US Conference on Teaching Statistics held at Ohio State University in June 2009), and are updated versions of the animations used in his talks on Informal Inference given to the Auckland Mathematical Association (July and November 2008) and the NZ National Numeracy Conference (February, 2009). Recordings and slides for the NZ talks can be found at http://www.censusatschool.org.nz/2009/informal-inference/.
The Animations
"Whenever I see
 I remember
 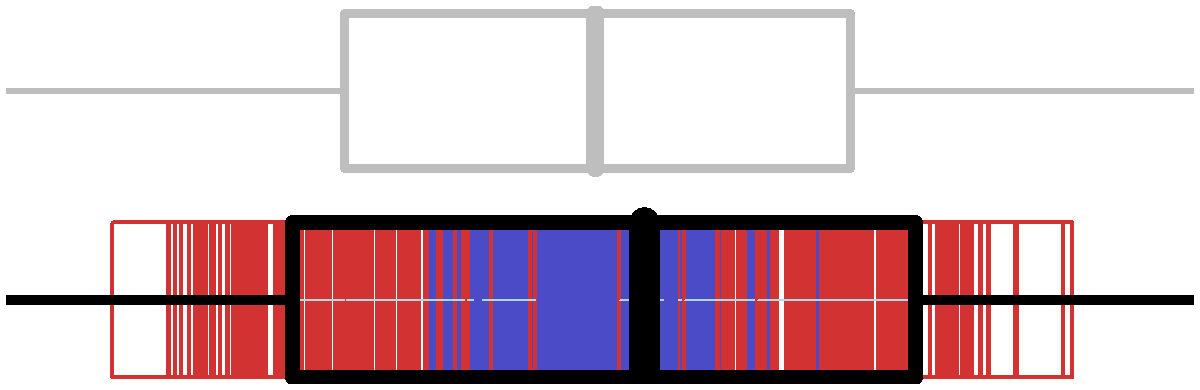 "
"The animations here are provided in the form of ordinary pdf files and also as animated gifs. To work with the pdf files via this page, you should have your browser open the pdf files rather than save them. You can save them for future use from the file menu of the browser or by right-clicking on the link button. (The files are up to 800 Kb in size so you may have to wait for download on slow connections.) The animated gifs can likewise be saved by right-clicking.
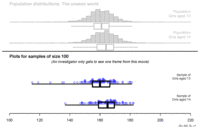
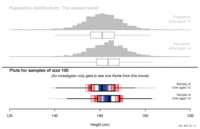
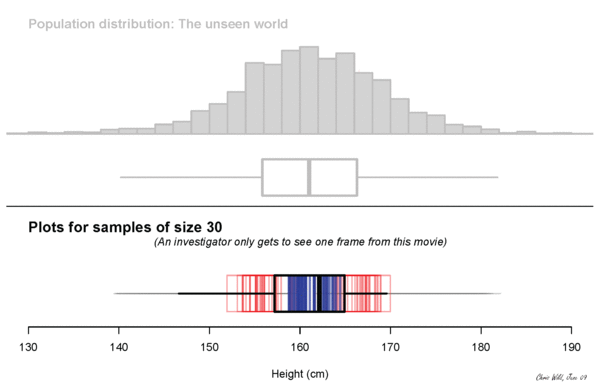
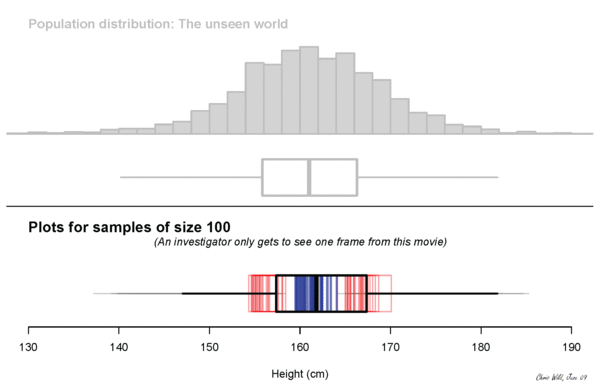
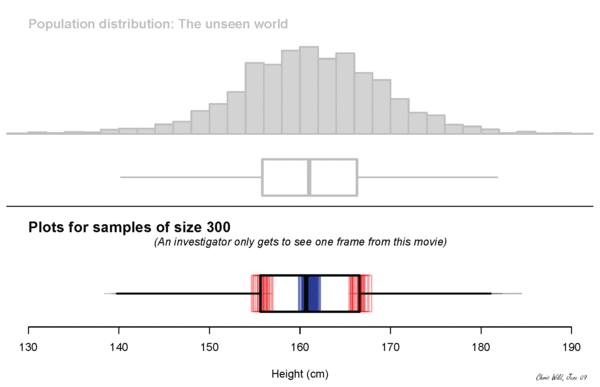
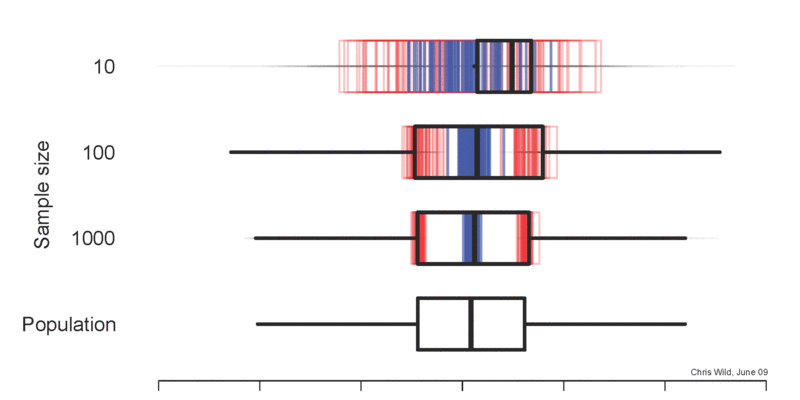
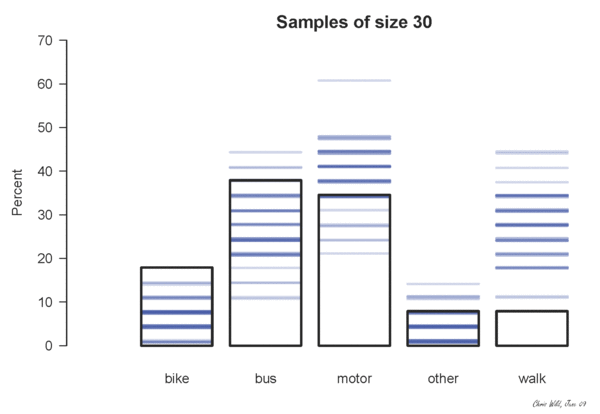
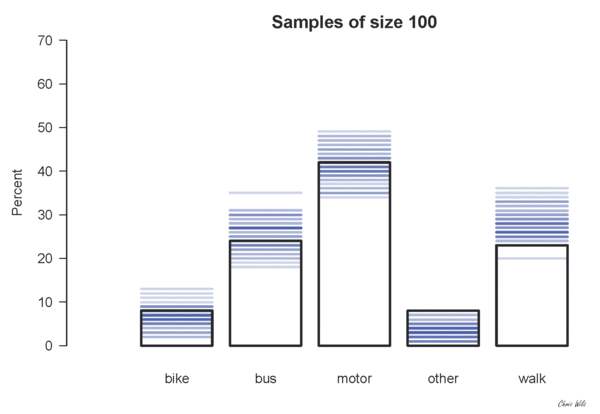
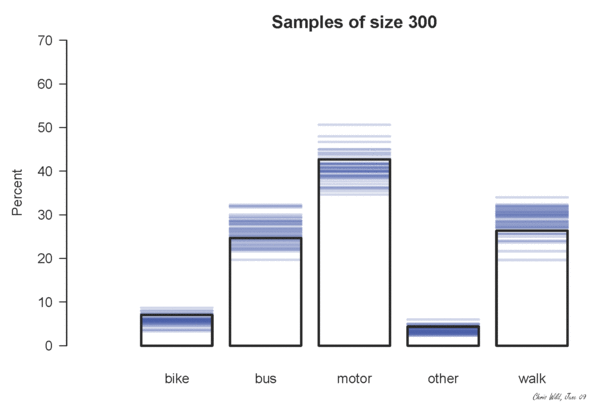
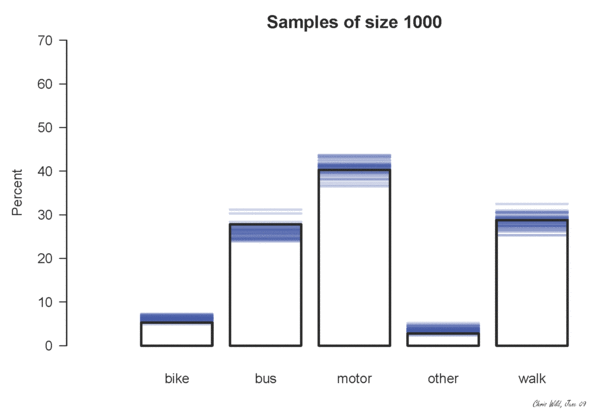
To understand how the animations work, recall that movies are simply a series of still images flashed on a screen in rapid succession. In using these with a class it is best to use the pdfs first until quite what it is that the animations are displaying has become well established. To step through a movie slowly, frame-by-frame, repeatedly press the right-arrow key. To play it fast, press the right arrow key and hold it down. It may be helpful to step through the first few frames of an animation slowly until you understand what it is depicting and then play the rest of it fast. Click on the buttons below the graphs to see the animations. The numbers are sample sizes. Use the back button to return to this screen.
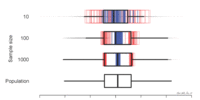
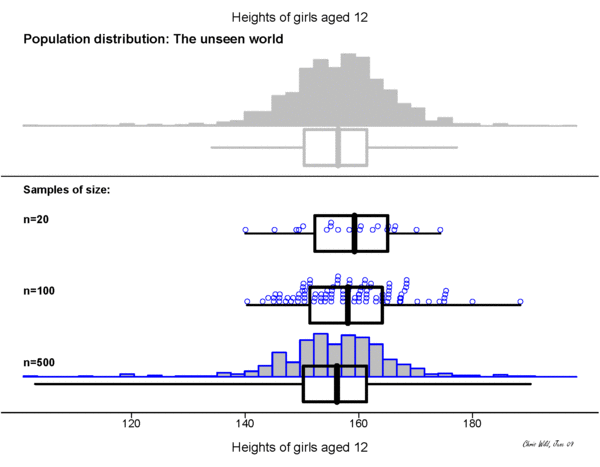
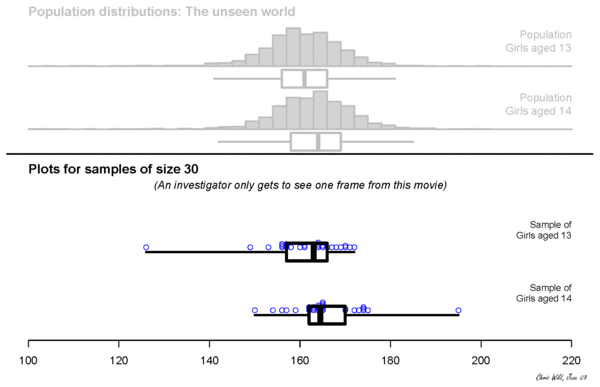
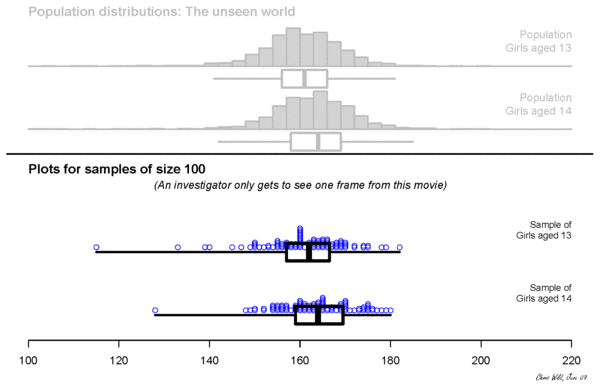
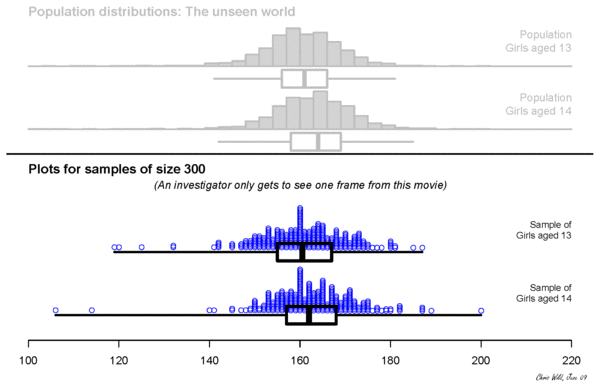
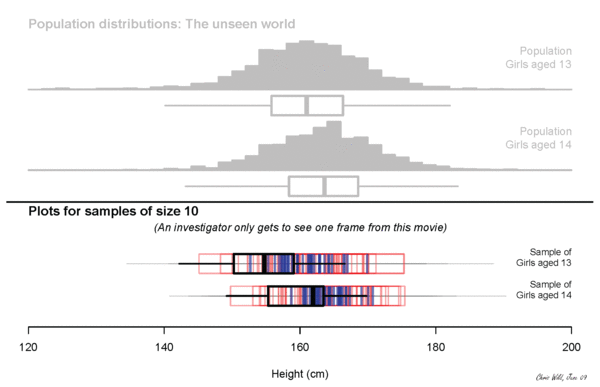
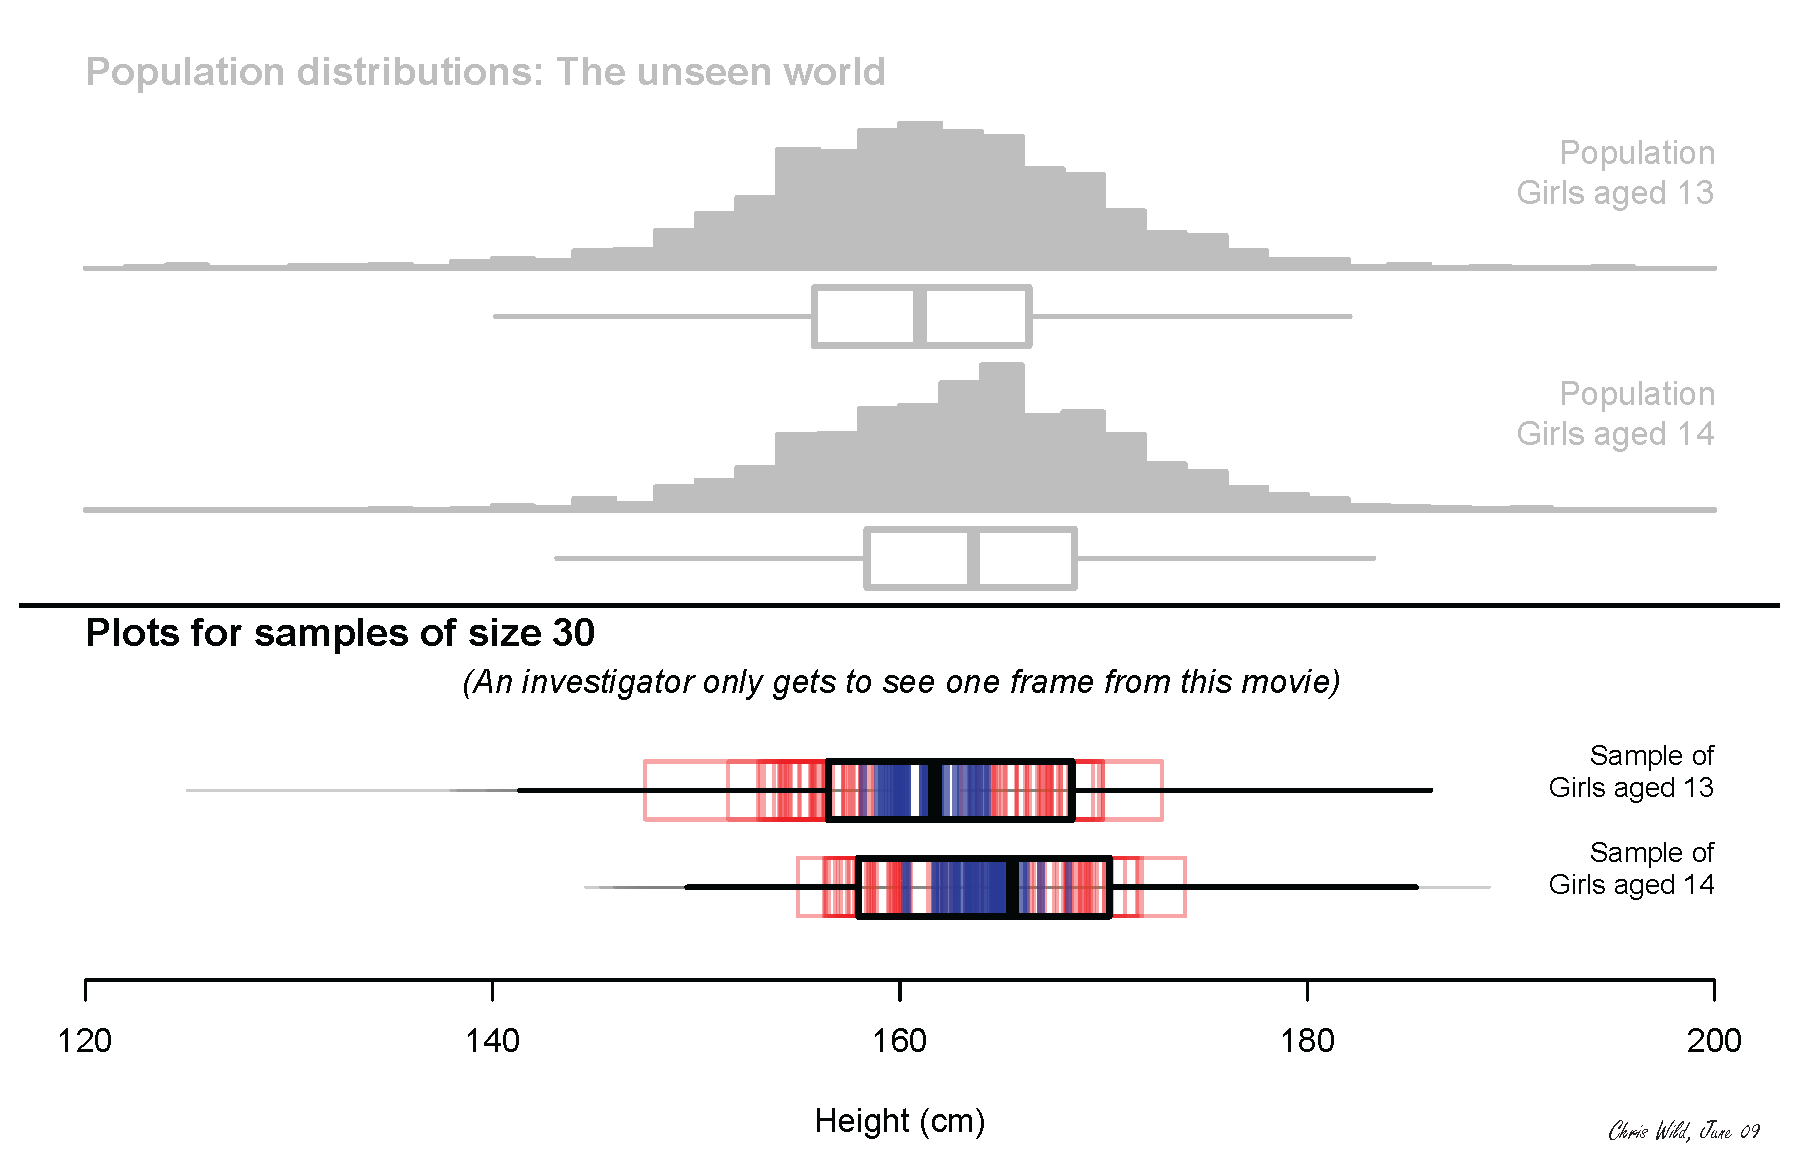
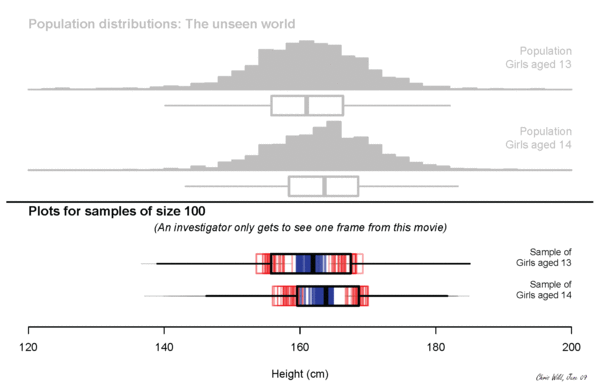
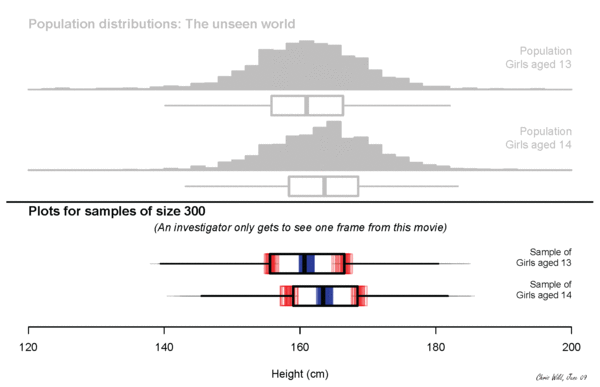
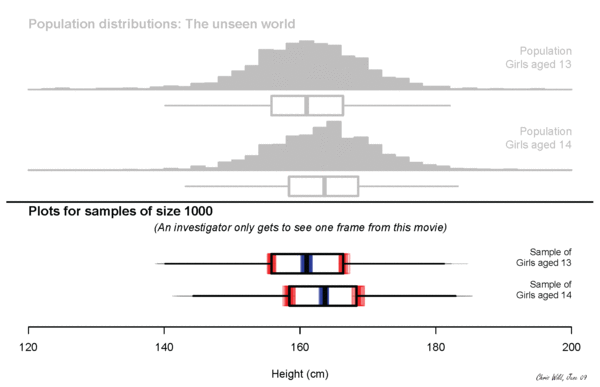
The animated gifs are for use in Powerpoint or similar presentations. They are designed to be good for leaving a "retinal image" of sampling variation and to be suggestive of the sort of uncertainty that it causes. This is particularly the case for "boxplots with a memory". In these the vertical blue lines are left by the medians of past samples and the red lines are left by quartiles of past samples.
Warning about resizing gifs in Powerpoint: I have found that resizing a gif in Powerpoint by dragging the corner can result in the gif failing to animate the next time the Powerpoint file is opened. Using the "Size and Position" dialog box (found in Windows by right clicking on the gif) is much more reliable. Rescalings of between 60% and 180% have been working reliably for me in Office 2007.
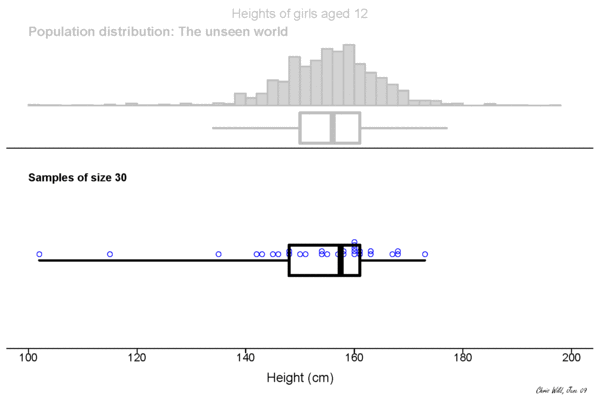
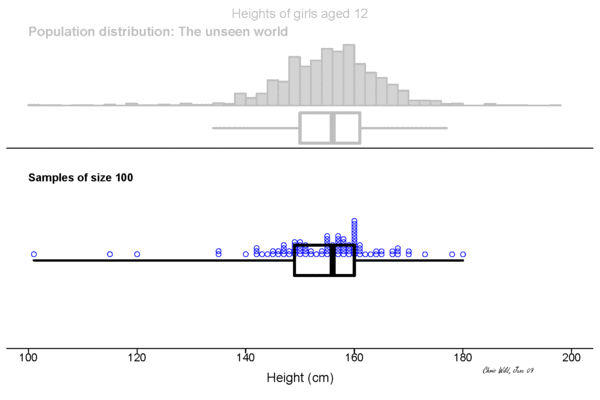
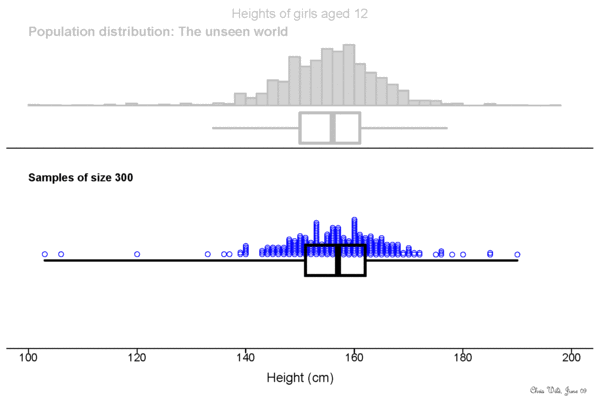
Where there are numbers underneath an animation thumbnail, these are links and relate to sample size. Click on the number to obtain the version of the animation above for that sample size.
Continuous Variables
One Population
 |
 |
|
| Animated Gifs | Click for: n=30 n=100 n=300 | Vew Full Size GIF |
| PDFs | Click for: n=30 n=100 n=300 | View Full size PDF |
| 1(a) | 1(b) | |
 |
 |
|
| Animated Gifs | Click for: n=30 n=100 n=300 | View full size GIF |
| PDFs | Click for: n=30 n=100 n=300 | View full size PDF |
| 2(a) | 2(b) |
Two Populations
 |
 |
|
| Animated Gifs | Click for: n=30 n=100 n=300 | Click for: n=10 n=30 n=100 n=300 n=1000 |
| PDFs | Click for: n=30 n=100 n=300 | Click for: n=10 n=30 n=100 n=300 n=1000 |
| 3(a) | 3(b) |