The movies show smooth versions of the catch heatmaps over time. The date cursor at
the top shows the date range for each frame. The date cursor turns red in the summer months and blue in the winter months, so you can get a quick feel for how catches change
over seasons.
Right-click on the movie image to save a copy to your own computer.
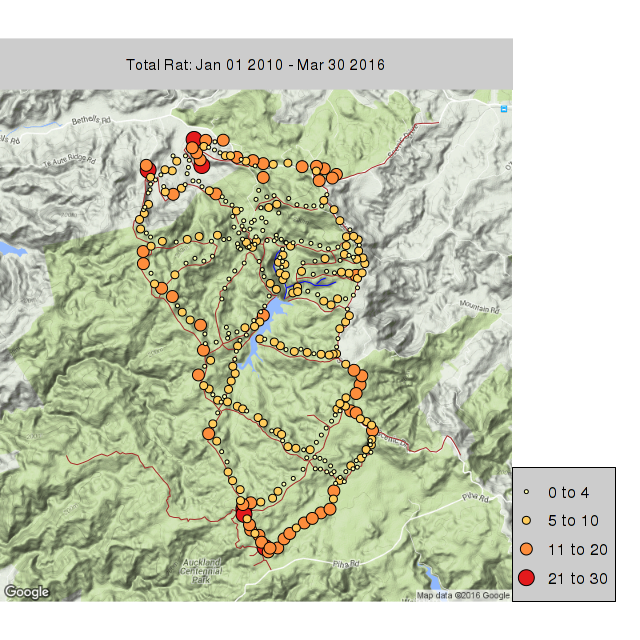
Rat catches 2010-2016 (2121 rats)
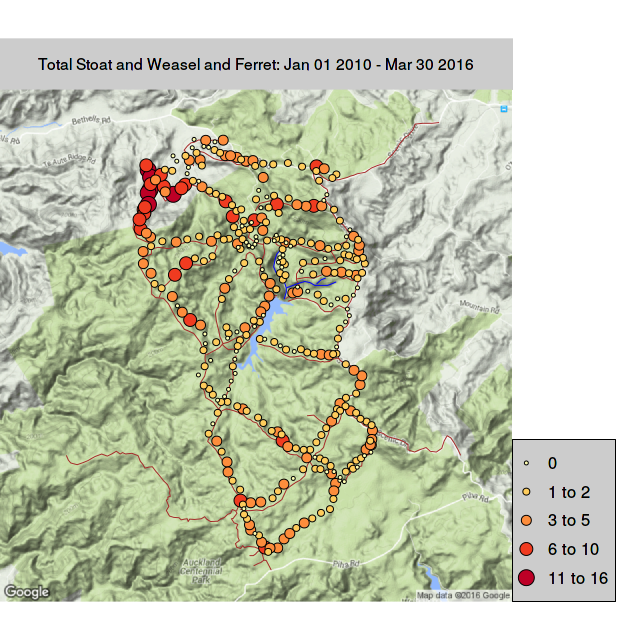
Stoat, Weasel, and Ferret catches 2010-2016 (623 stoats, 127 weasels, and 25 ferrets)
Rats and Stoats: side-by-side movies 2010-2016
Rats are on the left in red; Stoats, weasels, and ferrets are on the right in blue.
Rats and Stoats: focus on 2013-2015
This movie shows catches at a fine scale, month-by-month, covering 2013 to 2015 where
a major rat surge occurred. Trends are harder to see at this fine scale, but the
timing of surges is more precisely pinpointed.
Rats are on the left in red; Stoats, weasels, and ferrets are on the right in blue.
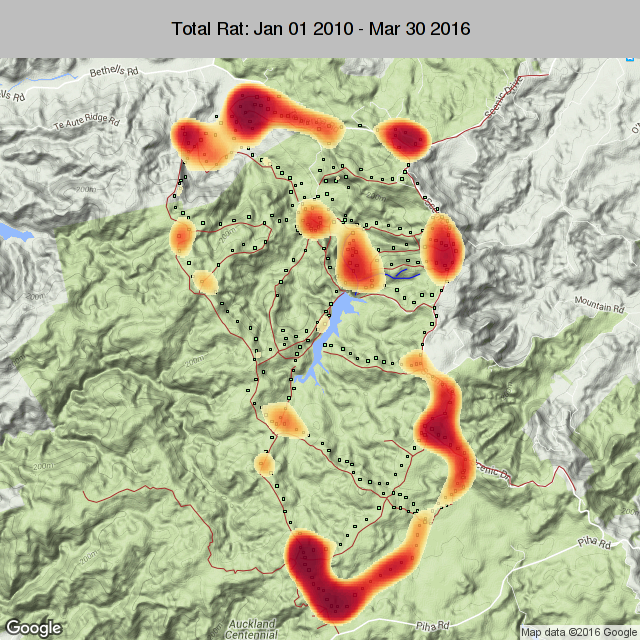
Total Rat Catch: 2010-2016 (2121 rats)
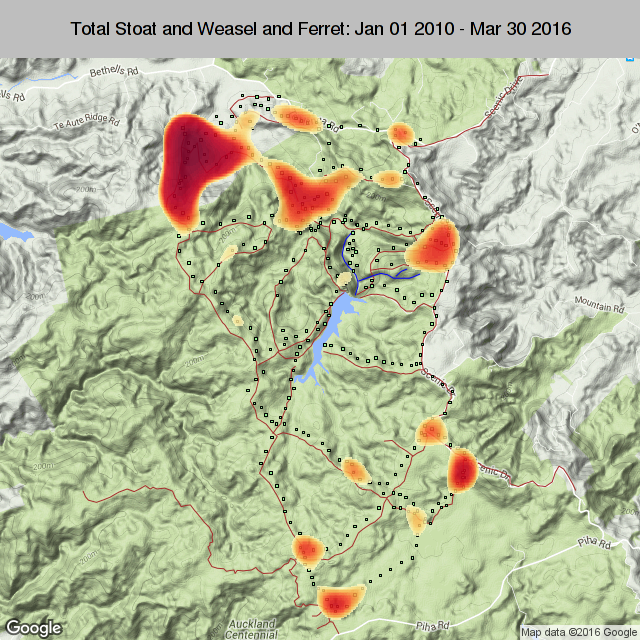
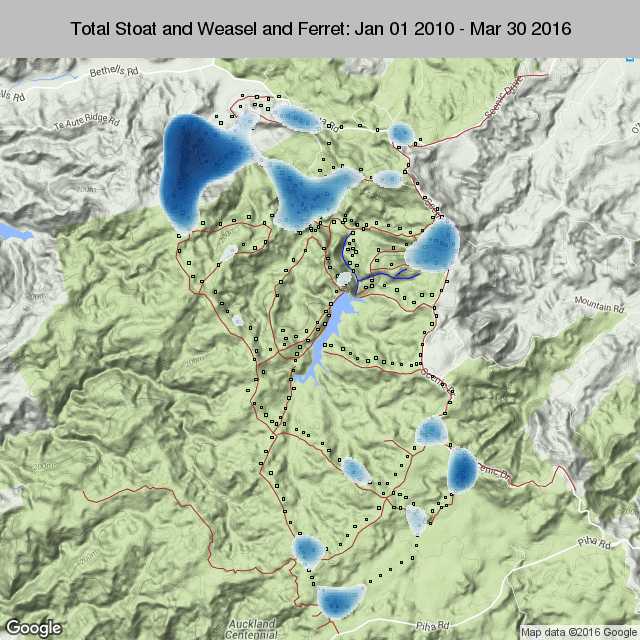
Total Stoat, Weasel, and Ferret Catch: 2010-2016 (623 stoats, 127 weasels, and 25 ferrets)
Mustelid hotspots with Rat hotspots overlaid: 2010-2016
The heatmaps show relative hotspots: they don't display absolute numbers.
Hotspots for Stoats, Weasels, and Ferrets are shown in blue. Hotspots for Rats are overlaid in yellow-red over the top.
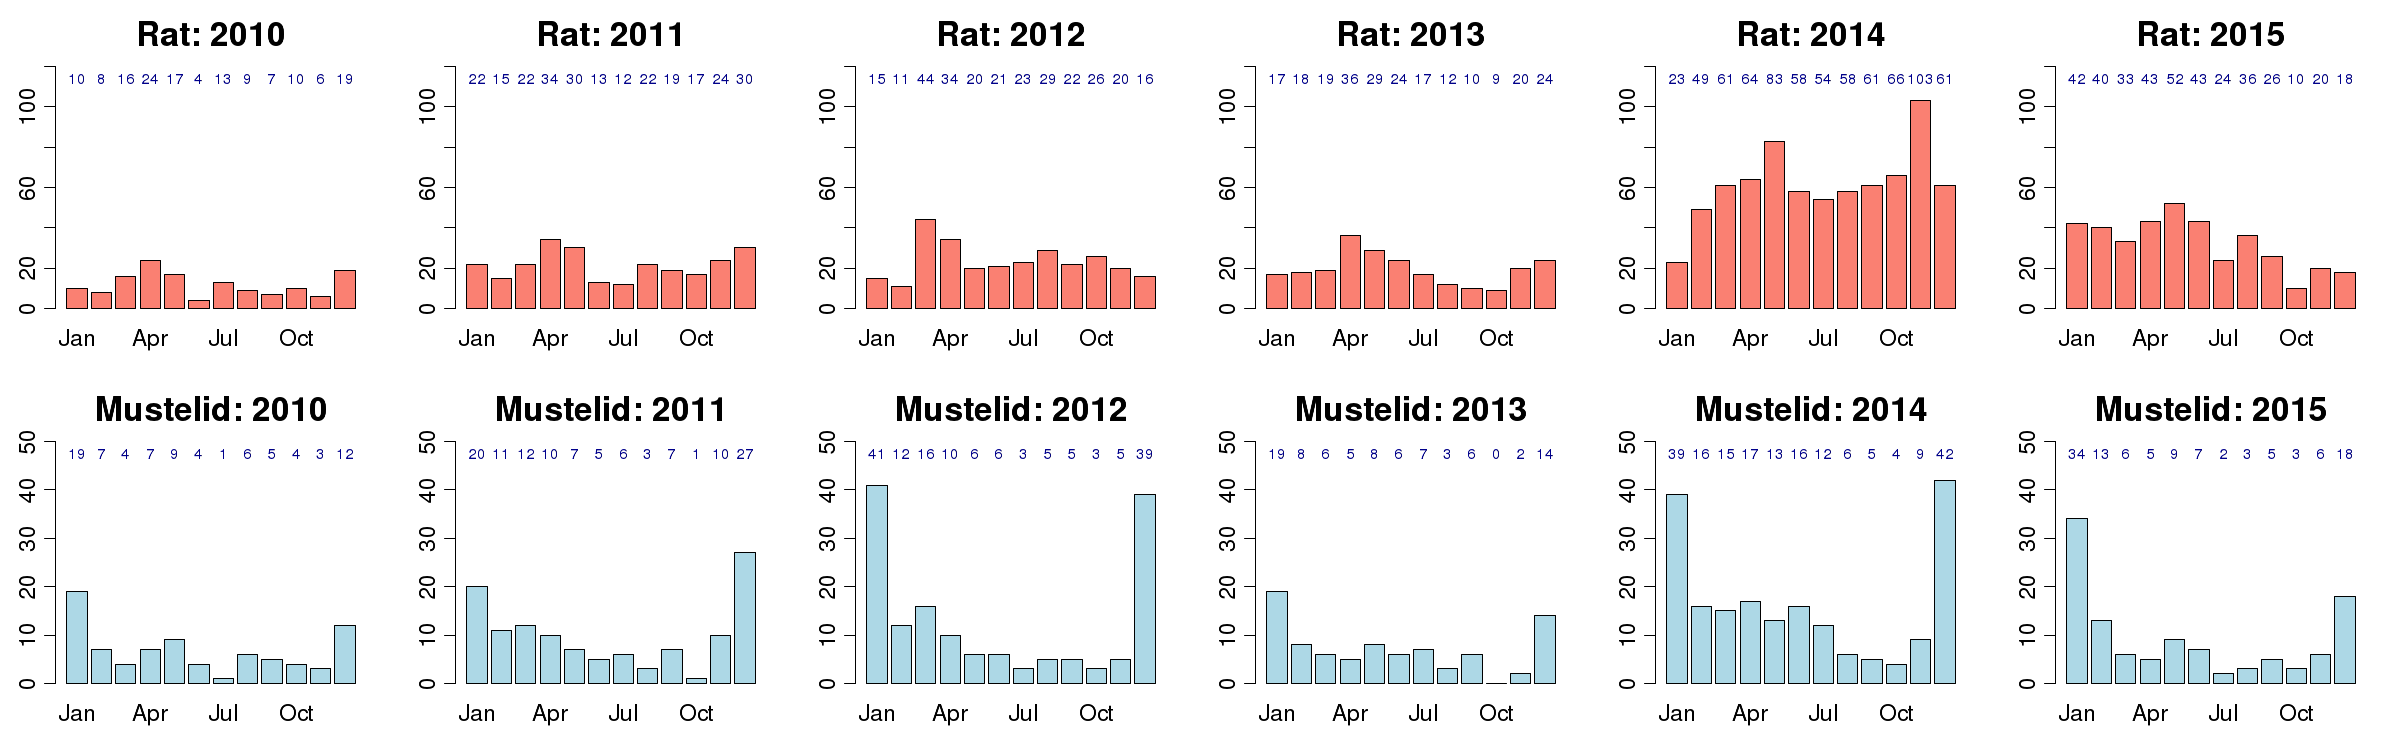
Barcharts by month: 2010-2015
Movies 2003-2016
These movies show results over time from the beginning of the Ark data in 2003. Because
we have data only for catches, and not for non-catches, traps (small squares) appear on
the map only when a catch was made during the corresponding timeframe.
Rat catches 2003-2016 (2878 rats)
Stoat, Weasel, and Ferret catches 2003-2016 (1078 stoats, 166 weasels, and 43 ferrets)
Rats and Stoats: side-by-side movies 2003-2016
Rats are on the left in red; Stoats, weasels, and ferrets are on the right in blue.
CatchIT is data-management software for conservation projects in New Zealand.
For questions or comments, please contact Rachel Fewster.