The movies show smooth versions of the catch heatmaps over time. The date cursor at
the top shows the date range for each frame. The date cursor turns red in the summer
months and blue in the winter months, so you can get a quick feel for how catches
change over seasons.
Right-click on the movie image to save a copy to your own computer.
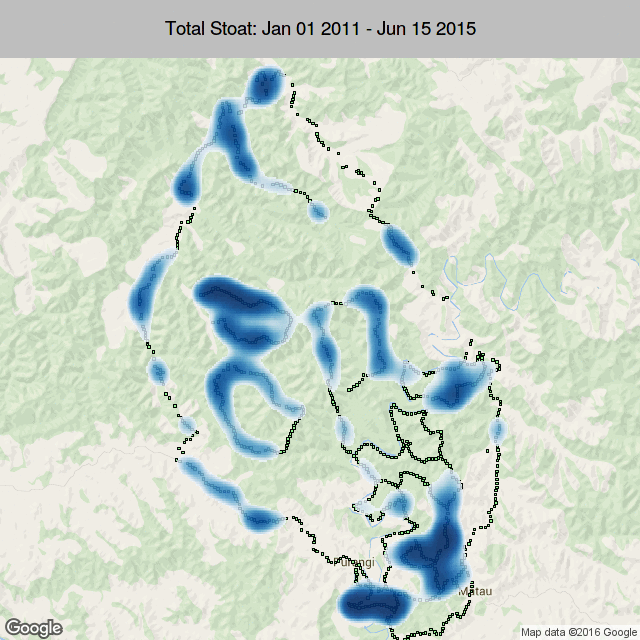
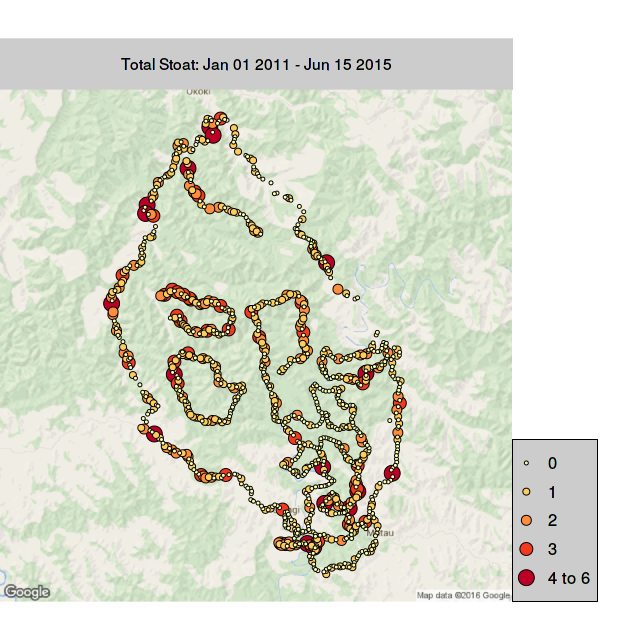
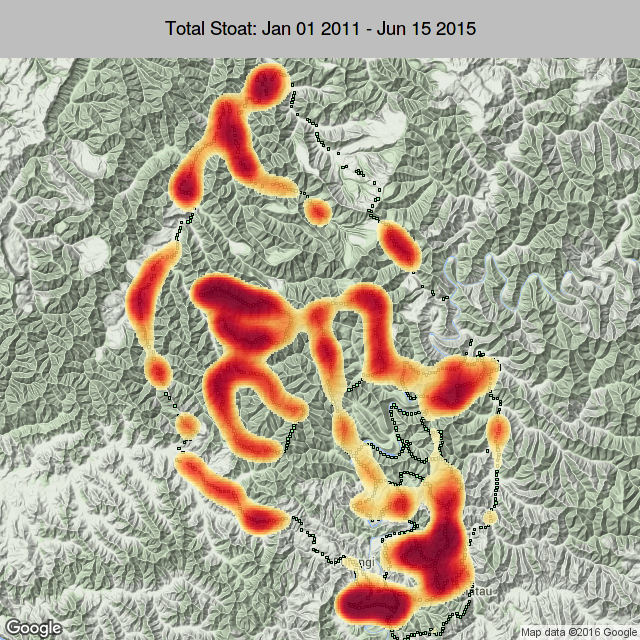
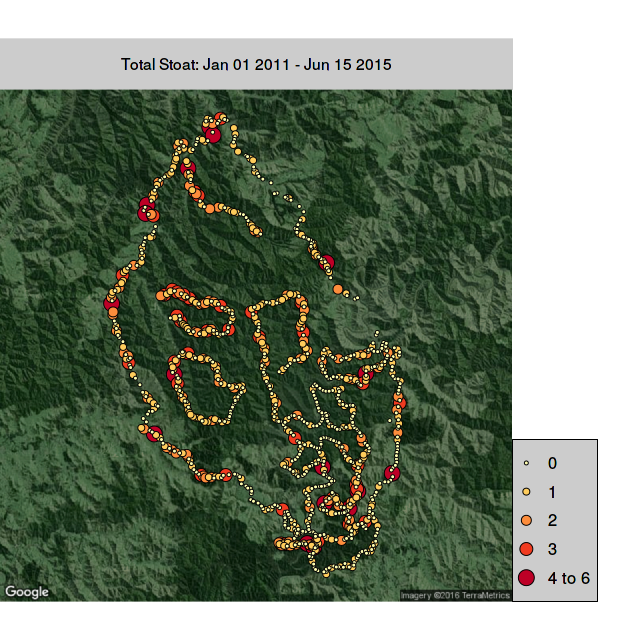
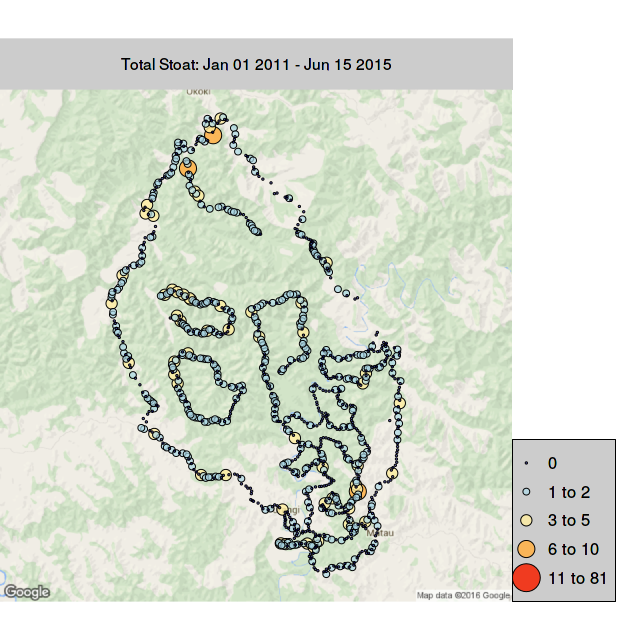
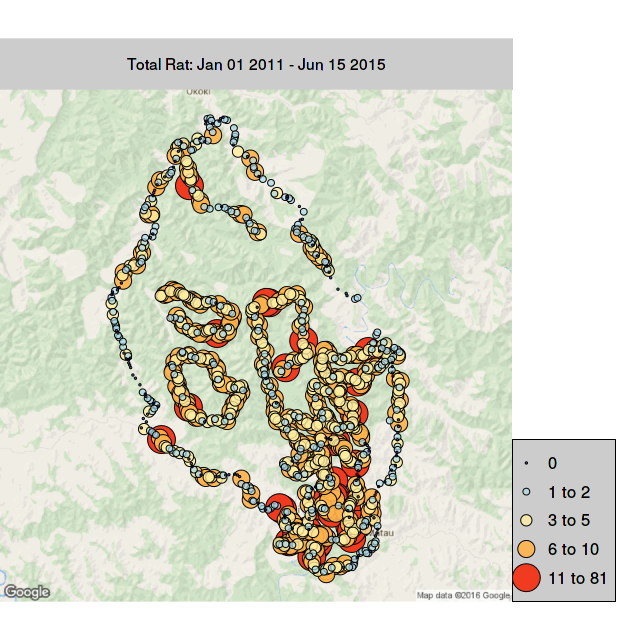
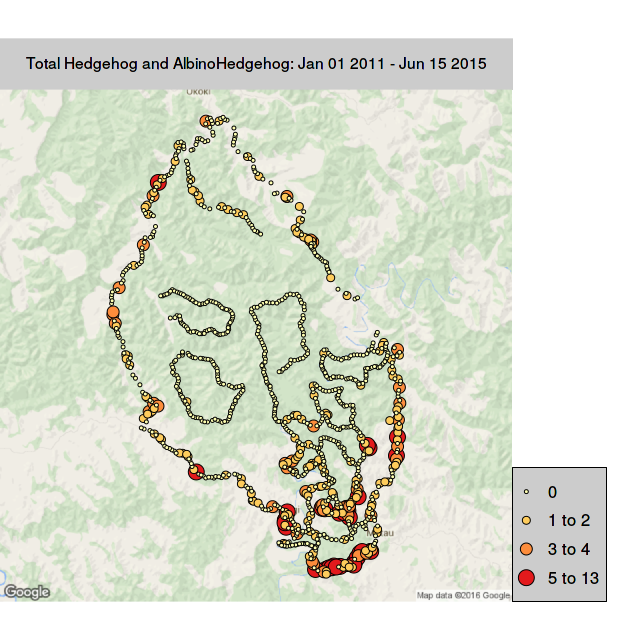
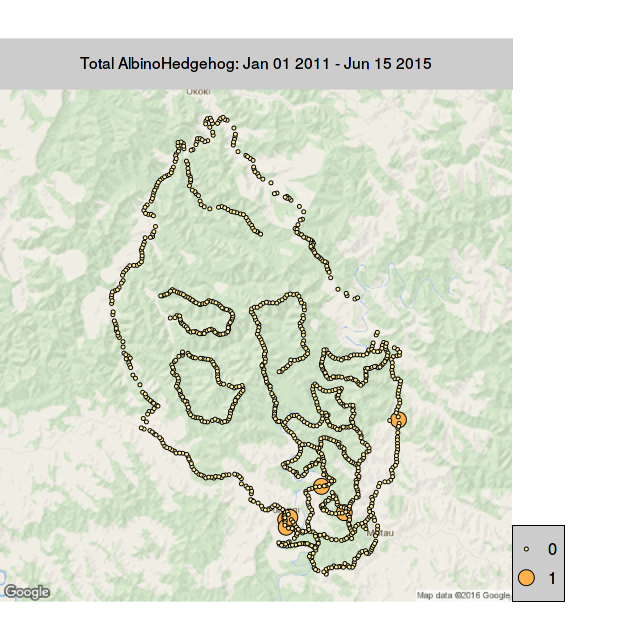
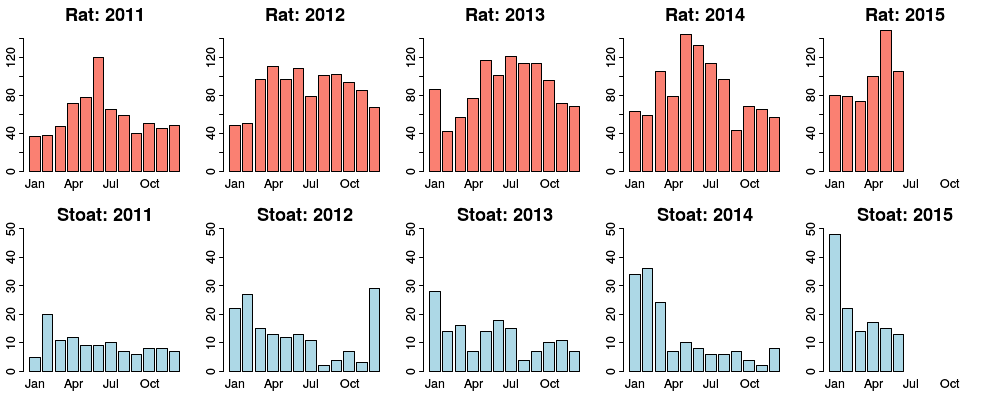
Stoat catches
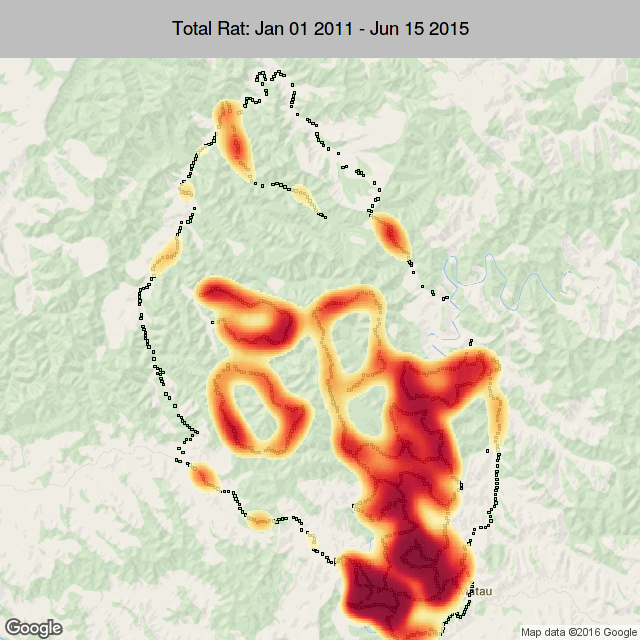
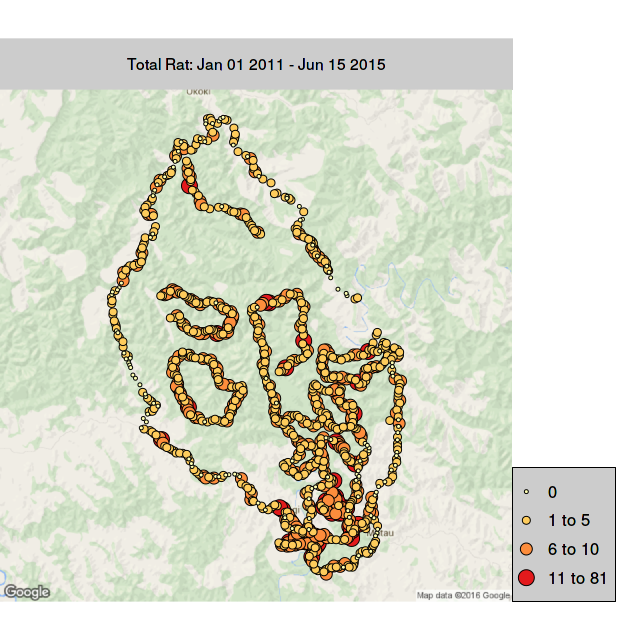
Rat catches
Rats and Stoats: side-by-side movies
Rats are on the left in red; stoats are on the right in blue.
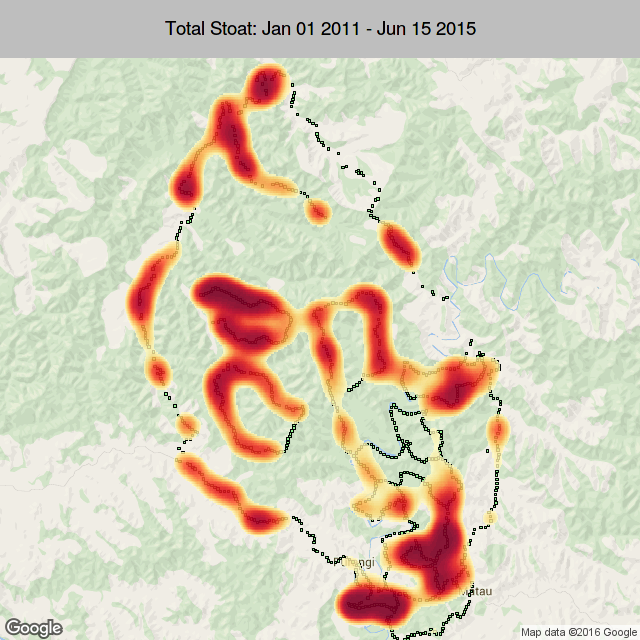
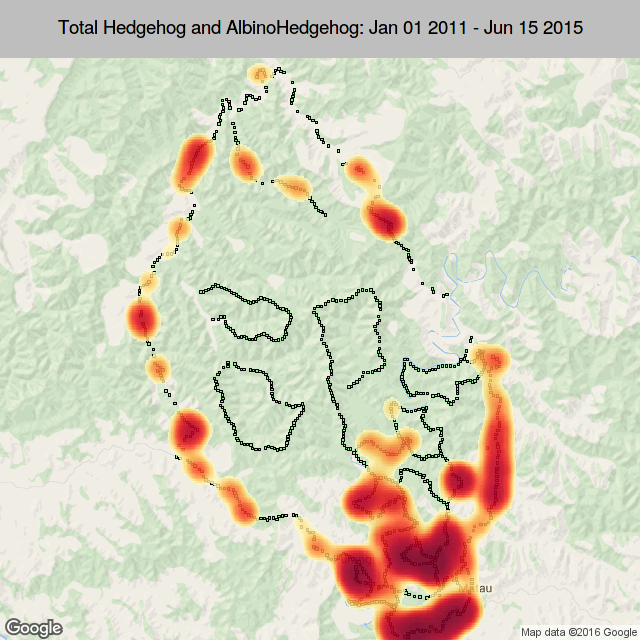
Stoat hotspots with Rat hotspots overlaid: 2011-2015
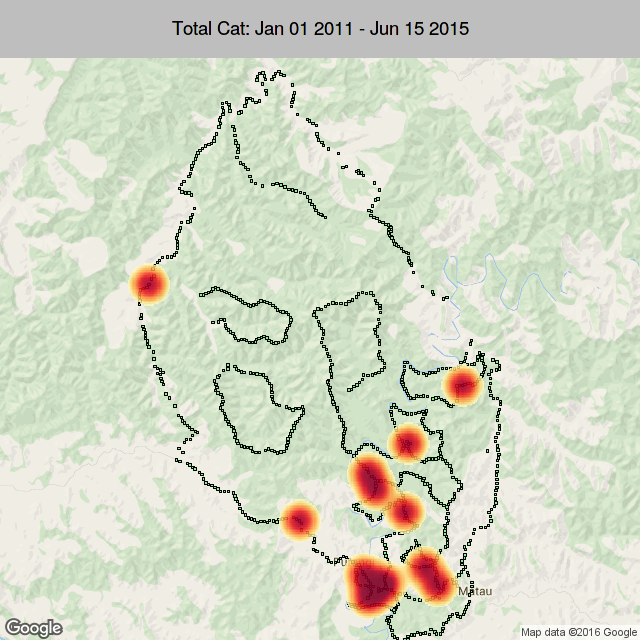
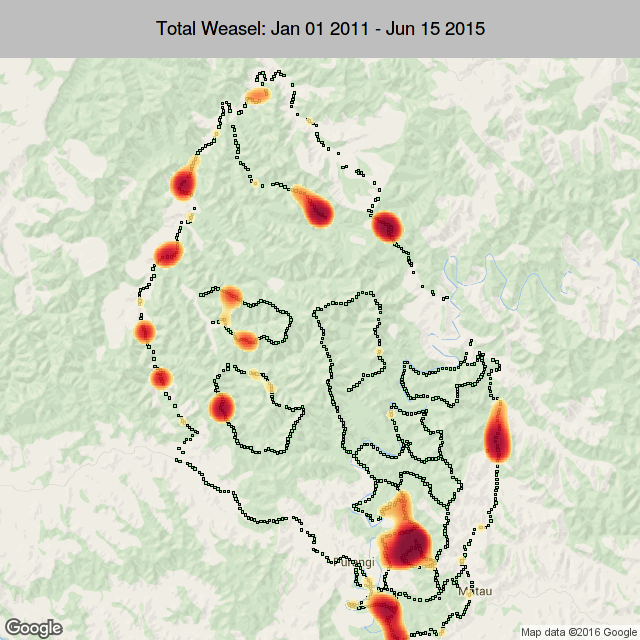
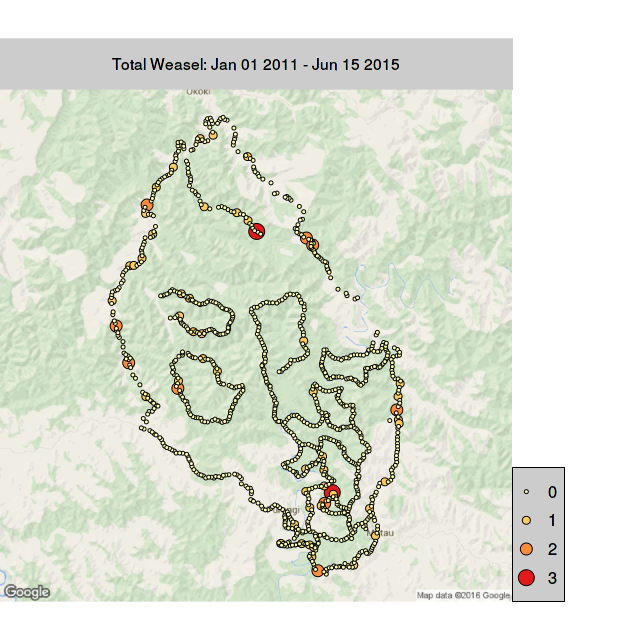
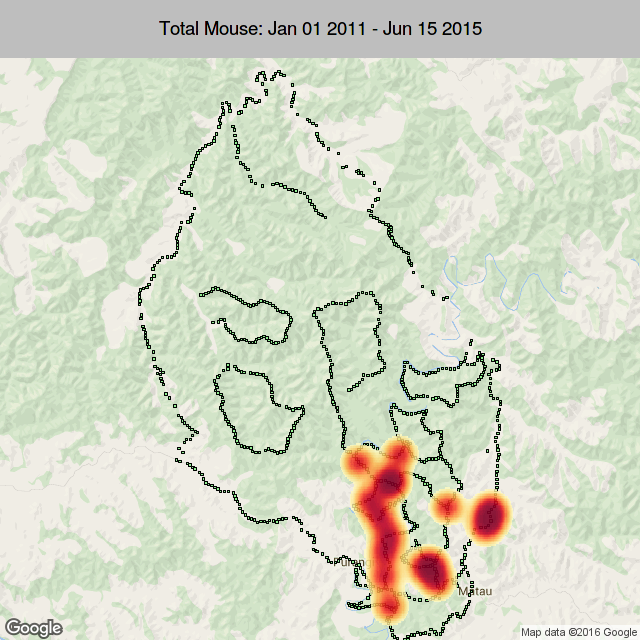
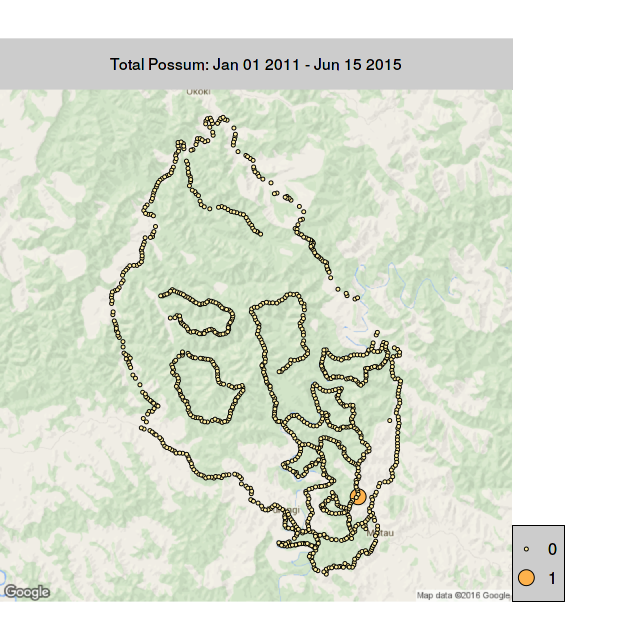
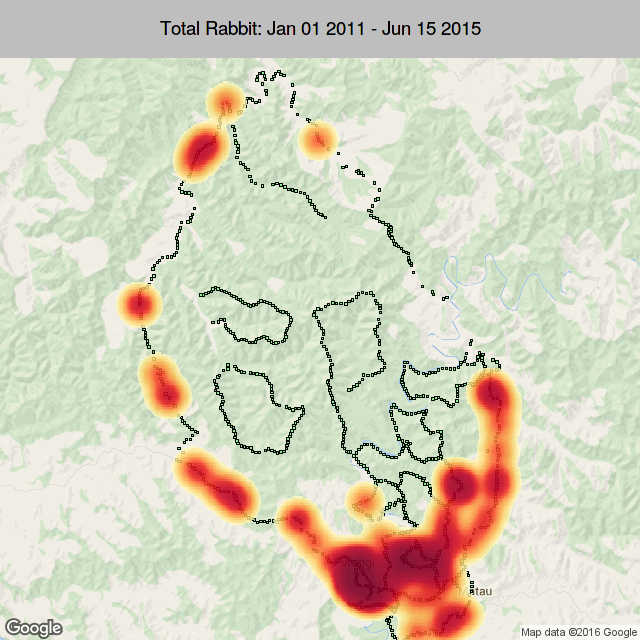
The heatmaps show relative hotspots: they don't display absolute numbers.
Hotspots for Stoats are shown in blue. Hotspots for Rats are overlaid in yellow-red over the top.
Detailed Animations
Click the links to see the animated graphics. Note: for long animations, you can let the animation run through once to upload it to your browser's cache; then replay it for a smoother animation.