 http://orcid.org/0000-0002-3224-8858
by Paul Murrell
http://orcid.org/0000-0002-3224-8858
Version 1:

This document
by Paul
Murrell is licensed under a Creative
Commons Attribution 4.0 International License.
This document describes an expansion of the R graphics engine to support a number of new graphical features: gradients, patterns, masks, and clipping paths.
These features are available in the development version of R (to become R 4.1.0).
R users wanting to try out the new graphics features should read the R API Section, which provides a quick introduction to the new R-level interface.
Maintainers of R packages that provide R graphics devices should read the Device API Section, which provides a description of the required changes to R graphics devices. This includes information about how to make sure your graphics device will compile with the new graphics features as well as information about how to add support for the new graphics features to your device.
The Internal details Section contains information on the internal design and internal code changes that have been made. This may be relevant for coders who make changes to the R graphics engine in the future.
NOTE that these new graphics features have not (yet) been
implemented for all of the graphics devices provided by the
'grDevices' package. Devices that do support
the new features are the
pdf() graphics device and Cairo graphics devices:
x11(type="cairo"), cairo_pdf(),
cairo_ps(), png(type="cairo"),
jpeg(type="cairo"), tiff(type="cairo"),
and svg().
The remainder of the
graphics devices in 'grDevices' will run, but will (silently) not
produce the correct output.
Graphics devices from other R packages are likely to crash R
until they are updated for the new features.
The R graphics engine (up to R version 4.0.*) only supports a limited set of graphical features: basic shapes like lines, rectangles, and circles; paths (including shapes with holes); text; raster images; and rectangular clipping regions. These features are sufficient to produce a wide range of statistical plots, but there are many things that R graphics cannot do.
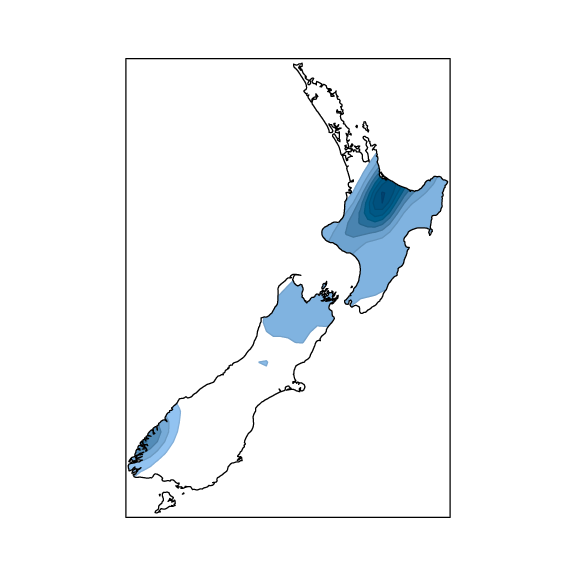
For example, the image below contains a set of filled contours within a map of New Zealand. The natural way to achieve this result would be to draw the filled contours and apply a clipping path to the filled contours based on the boundary of New Zealand. That is not something that can be achieved in R graphics (because R graphics only supports rectangular clipping regions).1
The 'riverplot' package (Weiner, 2017) can produce images like the one below, which appears to contain colour gradient fills, but it can only do so by drawing lots of filled polygons (of slightly different shades).
Similarly, the 'ggpattern' package package (FC, 2020) can produce pattern fills like the ones shown below, but only through a lot of hard work.
The new features in the graphics engine for R 4.1.0, including clipping paths, gradient fills, and pattern fills, expand the range of graphical images that can be produced (more conveniently) with R.
This section provides a brief introduction to the R-level interface for the new graphics features.
The new features are currently only available in the 'grid' graphics package. An API for the 'graphics' package may be developed in the future, but for now the only way to access these features in 'graphics' plots is to first convert the plot to 'grid' using the 'gridGraphics' package (Murrell and Wen, 2020).
The fill graphical parameter in 'grid', which specifies the
fill for closed shapes, can now be a linear gradient
(as well as a normal R colour).
The linearGradient function is used to
define the properties of the linear gradient.
A linear gradient is defined by a start point (default: bottom-left) and an end point (default: top-right) and a series of "stops" (default: black at the start and white at the end). Each stop is defined by a position on the line from start point to end point, plus a colour. We can also specify how the gradient "extends" beyond the first and last stops.
The following code creates a linear gradient that starts one inch off the bottom of the image, proceeds vertically to the top of the image, and transitions from red to yellow then back to red. The gradient is not drawn outside the end points (so the bottom of the rectangle is not filled).
When the gradient fill is specified on an individual grob, the start and end points are relative to the grob bounding box. The following code fills a rectangle in the central quarter of the image with the default linear gradient; the gradient starts at the bottom-left of the rectangle and ends at the top-right of the rectangle.
A gradient fill can also be specified on a viewport, in which case the gradient is relative to the viewport and all subsequent drawing makes use of that gradient (unless a new explicit fill is specified).
In the code below, we push a viewport that fills the whole image and specify the default linear gradient fill, so the gradient is relative to the whole image. We then draw a rectangle, with no explicit fill, so it "inherits" the gradient from the viewport.
In the next example, we have the same viewport, but we draw the rectangle only in the central quarter of the image. This shows that the gradient that the rectangle inherits is relative to the viewport rather than being relative to the rectangle.
The next example shows another variation on inheritance of gpar settings. This time a viewport is pushed with the default linear gradient and we draw a rectangle in the left third of the image that inherits that gradient (relative to the viewport). Then we push another viewport with a green fill and draw a rectangle within that viewport (in the centre of the image) and that rectangle inherits the green fill. Finally, we pop the second viewport and return to the first viewport and restore its linear gradient so that when we draw a rectangle in the right third of the image it again inherits the linear gradient (relative to the viewport).
The next example just shows that gradients work with translucent colours. We draw the text "Reveal" then over the top draw a rect with a gradient fill that transitions from (opaque) white to transparent.
The next example shows that radial gradients work via
the same interface. We specify the properties of a radial
gradient with the radialGradient function.
As with linear gradients, we have control over the start and end of the radial gradient, though in the radial case it is a start circle and an end circle. In the code below, we make a gradient that starts near the top right of the image (with white and zero radius) and ends with a circle that is centred on the image and has diameter the size of the image (and is black).
The next example shows that we can add a gradient to an existing image, in this case a 'ggplot2' plot. Here we edit the background of the plot panel to add a grey-to-white gradient.
The next example is similar, but demonstrates that, even with gradients only implemented in 'grid', we can still add gradients to 'graphics' plots if we first convert them using the 'gridGraphics' package.
The fill graphical parameter can now also be a general pattern.
We specify a pattern with the pattern function, which
takes a grob as its first argument.
The pattern function takes a grob
and draws it as the fill for another grob.
In the code below, the pattern is three coloured circles
and this is used to fill a rectangle.
Patterns on grobs are relative to the grob; the example below is the same as the example above except that the rectangle is half as wide. The circles have absolute radius so they stay the same size, but their locations are relative to the rectangle that they are filling so they now overlap.
The next example shows that patterns on viewports are relative to the viewport. Here we set the pattern fill to be the same as the previous two examples, relative to a viewport that is the size of the image. We draw a rectangle half the width of the viewport, that inherits the pattern fill, but the fill is relative to the viewport so the pattern extends beyond the limits of the rectangle.
A pattern can be any 'grid' grob, which means the pattern could be a gTree or, as below, it could have its own viewport. The image below is a rectangle filled with a pattern that consists of three circle drawn within a viewport that defines a linear gradient fill.
Patterns can "extend" like gradient fills; probably the most
typical use of a pattern will draw a simple shape and then
specify extend="repeat"
to fill a region.
To do this, we must specify a size for the pattern (this specifies
a "size" for the "tile" that gets repeated).
For example, the code below fills a rectangle with a polka-dot
pattern by specifying a circle as the pattern and specifying that
the pattern size is just a little bit larger than the circle
and specifying that the pattern repeats.
The clip argument for the viewport function
can now also be a 'grid' grob (in addition to the existing
"on", which only enforces a rectangular clipping region).
The grob defines a path that is used
to set the clipping region.
A simple example is clipping output (in this case text) to a circle. The text and the circle are both drawn in grey and then the text is drawn black with the circle used as a clipping path.
A slightly more dramatic example involves clipping text to several circles at once. Note that this still only requires a single grob to specify the clipping path.
The clipping path is relative to the viewport and
clipping paths are inherited like the existing clip
settings.
In the following code (after drawing everything in grey without any clipping), we push a viewport with three circles as the clipping path, then we draw the text "test one", which gets clipped to the circles. Next, we push another viewport in the bottom third of the image, which inherits the clipping path, and we draw the text "test two", which also gets clipped to the circles. Finally, we pop those two viewports and push a third viewport in the top third of the image; now there is no clipping path in effect (because we popped the viewport with a clipping path), so when we draw the text "test three" the text is not clipped at all.
Although a clipping path can be an arbitrary 'grid' grob,
clipping and masks (see below) are disallowed within a clipping path.
Any viewport that sets clip=TRUE or clip=FALSE
or sets clip to be a grob, or that sets mask
to be a grob, will generate a warning and the clipping setting
(or the mask) will be ignored for determining the clipping path.
This constraint has been applied for several reasons: to make life easier for graphics devices; because it is very difficult or impossible to achieve some nested clipping effects on some devices; because formats like PDF and SVG enforce limits on what can go in a clipping path; and fancy clipping shapes can be achieved by using a mask instead.
A 'grid' viewport can now have a mask (in addition to
clip). This value should be either "inherit"
(the default), in which case the viewport inherits the mask from
its parent, "none", in which case the viewport does not
mask its content, or a 'grid' grob that defines a new mask for the
viewport.
The following example defines a circle grob with a radial gradient fill that starts at black in the centre and gradually transitions to transparent at the circumference. A viewport is pushed with this circle grob as the mask, then a rectangle is drawn half the width of the viewport and filled with solid black. The result is that only the parts of the rectangle where the mask is non-transparent are drawn; the rectangle is filtered by the mask.
The following code blends two 'ggplot2' plots using a mask. This time the mask is a linear gradient from black 30% of the way up the page to transparent 70% of the way up the page. First, we draw a plot with the default ggplot2 theme, then we draw a black-and-white themed version of the same plot on top, using the mask, so from 30% up the page the black-and-white plot transitions smoothly into the default themed plot.
Here is an example of a relatively complex mask that cannot be achieved with clipping paths (because it would require nesting clipping paths). The mask consists of two narrow rectangles, but the left rectangle is drawn within a viewport with a circular clipping path, so it gets clipped. The mask is then applied to a solid grey rectangle and the result is the shape of the mask. The same effect could be achieved by replacing the clipping path with a mask (nested masks are ok).
This section describes the (minimal) changes that a graphics device package must make in order to build with the new version of R. There are also some comments about implementing support for the new graphics features. Device authors planning to implement support could also read the Internal details Section to see how support has been implemented for the Cairo and PDF devices.
A device must implement a new dev->setPattern function.
This accepts an R object as the pattern, but it can just
return NULL. A C API is provided for
extracting components of the pattern fill (see the
Internal details Section).
There is new R_GE_gcontent.patternFill, but a device
can just ignore it
(because R_GE_gcontext.fill is always set; it will just
be "transparent" when a pattern fill has been specified).
If the device implements patterns, it must
return a pattern reference (as an R object) as the
return value from this function. This reference
is passed back to the device via R_GE_gcontent.patternFill.
A device
must also
implement dev->releasePattern, but it can just do nothing.
A device
must implement the new function
dev->setClipPath. This accepts a clipping path
as an R function object, plus a reference to an existing clipping path
(also an R object), but it can just return
NULL if clipping paths are not supported.
There are three levels of support: none, in which case the device ignores the clipping path request (and returns NULL); non-caching, where the device sets clipping paths, but returns NULL, so it will always generate a new clipping path on every request; and caching, where the device sets clipping paths, caches clipping paths, and returns a reference to the cache, and the reference only has to make sense to the device.
A device
must also implement dev->releaseClipPath,
but can just do nothing.
A device must implement the new function
dev->setMask. This accepts a mask as an R function object,
plus a reference to an existing mask (also an R object),
but it can just return NULL.
As with clipping paths, there are three levels of support:
none, non-caching, and caching.
A device
must also implement dev->releaseMask, but can just do nothing.
As an example of the (minimal) changes necessary to update a device
(without support for any of the new features), the following
diff shows the changes to get the quartz device
running on macOS (at r78533).
@@ -371,6 +371,12 @@
+static SEXP     RQuartz_setPattern(SEXP pattern, pDevDesc dd);
+static void     RQuartz_releasePattern(SEXP ref, pDevDesc dd);
+static SEXP     RQuartz_setClipPath(SEXP path, SEXP ref, pDevDesc dd);
+static void     RQuartz_releaseClipPath(SEXP ref, pDevDesc dd);
+static SEXP     RQuartz_setMask(SEXP path, SEXP ref, pDevDesc dd);
+static void     RQuartz_releaseMask(SEXP ref, pDevDesc dd);

@@ -430,6 +436,13 @@
+    dev->setPattern      = RQuartz_setPattern;
+    dev->releasePattern  = RQuartz_releasePattern;
+    dev->setClipPath     = RQuartz_setClipPath;
+    dev->releaseClipPath = RQuartz_releaseClipPath;
+    dev->setMask         = RQuartz_setMask;
+    dev->releaseMask     = RQuartz_releaseMask;

@@ -1282,6 +1295,24 @@
+static SEXP RQuartz_setPattern(SEXP pattern, pDevDesc dd) {
+    return R_NilValue;
+}
+
+static void RQuartz_releasePattern(SEXP ref, pDevDesc dd) {}
+
+static SEXP RQuartz_setClipPath(SEXP path, SEXP ref, pDevDesc dd) {
+    return R_NilValue;
+}
+
+static void RQuartz_releaseClipPath(SEXP ref, pDevDesc dd) {}
+
+static SEXP RQuartz_setMask(SEXP path, SEXP ref, pDevDesc dd) {
+    return R_NilValue;
+}
+
+static void RQuartz_releaseMask(SEXP ref, pDevDesc dd) {}
Implementing proper support for the new graphics features is a lot more work, but the Cairo and PDF devices in 'grDevices' provide two examples to follow.
The easiest feature to support is gradient fills. The graphics engine passes an R object describing the gradient and the device just has to convert that to an appropriate representation, if possible, and enforce that fill for closed shapes.
Clipping paths are next easiest, but a significant step up. On one hand, all that the device has to do is call the R function that is passed in as the clipping path. The hard part though is coping with the fact that that function will generate calls back to the device to draw the clipping path. The devices that have been implemented so far maintain a modal environment so that calls to draw shapes can react differently when a clipping path is being defined compared to when normal drawing is happening. Having captured the definition of the clipping path, the device must also enforce the clipping path.
Masks and patterns are hardest of all. Like clipping paths, the device just has to call an R function to define the mask or pattern. However, as well as the problem of handling calls back to the device, there is the additional problem that those calls may define a clipping path, a mask, or a pattern. On the devices that have implemented support, this requires more complex maintenance of drawing modes to figure out what to do with calls to the device (depending on whether normal drawing is occurring, or we are defining a clipping path, or we are defining a pattern or a mask). The device must also enforce the mask whenever a mask is set.
This section records details of the internal design and implementation of the new graphical features. Some of this may be helpful information for authors of graphics device packages.
The graphics engine version, R_GE_version,
has been bumped to 13 (R_GE_definitions)
to reflect these changes.
There is also a new dev->deviceVersion component
that devices should maintain; this is to support
smoother transitions to new graphics engine versions in the future.
A patternFill
property has been added to the R_GE_gcontext
(graphical context)
in the graphics engine.
This property can be either NULL
(indicating no pattern fill) or an R object, which
represents a reference to one of the current pattern fills on
the graphics device.
This property is in addition to the existing fill
property. If patternFill is non-NULL
then it should override fill. This makes it easy
for a graphics device to ignore patternFill
if it wants to.
A grDevices::.linearGradientPattern function has been added.
This is not meant to be called
directly by users; it is there for 'grid' (and 'graphics') to use.
The idea is that 'grid' and 'graphics' can have user-level
interfaces to define gradients and those are
converted to graphics engine versions of the gradients
for drawing. There is also a
grDevices::.radialGradientPattern.
A setPattern device function has been added to
allow the graphics engine to ask a graphics device to create
a pattern. The function takes a "Pattern" object
(a linear gradient or radial gradient or tiling pattern)
and returns an R object
(a reference to be used as patternFill within
an R_GE_gcontext).
There is also a releasePattern device function
so that, e.g., 'grid' can release a pattern that is just set on
a grob (and release all patterns on a new page). We specify
NULL to this call
to release all patterns.
The "pattern" sent to
setPattern is an SEXP,
which means it is sort of an opaque pointer in C code,
so the graphics engine provides a C API for extracting
information from a "pattern" object.
For example,
R_GE_isPattern can be called to check for a pattern fill,
R_GE_patternType can be called to get the pattern type, and
R_GE_linearGradientNumStops can be called
to get the number of stops from a LinearGradient SEXP.
The Cairo graphics devices
have implemented setPattern
and releasePattern and maintain an array
of patterns. These devices observe the new
R_GE_gcontext.gradientFill setting
and uses the value
as an index into the array of patterns.
The 'grid' package provides a new linearGradient
function for defining a linear gradient in 'grid'
(this creates a GridPattern object).
One notable difference from grDevices::.linearGradientPattern
is that the start and end points for
the gradient can be defined using 'grid' units.
The gpar function also allows
a GridPattern as the value for the
fill property.
When gpar settings are enforced during drawing a grob, a
pattern fill is resolved to a graphics engine
Pattern (for example, the start and end
points for a linear gradient are converted to locations on the graphics
device).
If the pattern fill is specified on a viewport, the pattern definition
is relative to that viewport; if the pattern fill is specified
on a grob, then the pattern definition is
relative to the bounding box of the grob.
'grid' calls setPattern to "resolve" a pattern
and generates a GridResolvedPattern, which contains
the reference from setPattern. This allows
'grid' to reuse the pattern reference, e.g., when drawing
multiple shapes from a single grob, or when revisiting a
viewport (so that it does not have to ask the graphics device
for a new pattern for every shape or for every visit to a viewport).
When drawing a grob, 'grid' resolves the pattern relative to the grob,
stores the pattern reference in the current gpar setting
and, when setting the R_GE_gcontext, sets the
patternFill and uses that for every shape that is drawn
from this grob. The pattern is released after the grob is drawn.
When pushing a viewport, 'grid' resolves
the pattern relative to the viewport
and stores the resolved pattern in the gpar of the pushed viewport, so that
revisits to the viewport can reuse the resolved pattern.
The resolved pattern is only stored in the pushed viewport so
that replays of the grid display list (e.g., grid.edit)
or the graphics engine display list (e.g., device resize or
device copy) will always resolve the pattern again.
When starting a new page, 'grid' releases all patterns.
Patterns use the same R_GE_context slot as gradients;
a drawing can have a gradient OR a pattern fill OR a normal fill.
Patterns are passed to graphics devices via the same
setPattern device function.
There is a grDevices::.tilingPattern function for
'graphics' and 'grid' to use to create a pattern and there
is a C API for graphics devices to safely extract components
of the tiling pattern.
'grid' creates a GridTilingPattern object,
which is a list with a component, f,
that contains a function to draw the grob that defines the pattern,
plus the location, size, and extend rule for the pattern.
The Cairo graphics device creates a pattern by running the pattern
function within a cairo_push_group and
cairo_pop_group. This means that the pattern
is drawn on a temporary surface and then that drawing is turned into
a Cairo pattern to use as the source for filling other drawing.
The same pattern resolution in 'grid' is used as for gradients; the same pattern array on the Cairo device is used as for gradients.
A setClipPath device function has been added to allow
the graphics engine (or graphics systems) to ask a device to
define a clipping path. The function takes a path
and a ref and should return a reference to
the clipping path on the device. All three values are SEXPs,
but all the device needs to know about the path is that
it is an R function (with no arguments) that the device should
call to create the clipping path. More on how that works in a second.
All the graphics engine (or graphics systems) need to know about the
reference to a clipping path is ... nothing. These references are
generated by the device, passed back to the graphics engine, then
sent in again to the device. The graphics engine (or graphics
systems) only stores the references and passes them back to the device;
the references only have
meaning within the graphics device.
There is also a releaseClipPath device function,
which takes a reference to a clipping path so that the graphics engine
(or graphics systems) can indicate to the device that a clipping path
is no longer required.
When a 'grid' viewport is created with a grob as the clip
argument, a "GridClipPath" object is created, which
is a function that draws the grob. When a 'grid' viewport is pushed,
the clipping path is "resolved" by calling setClipPath
on the graphics device
(via R and C interface functions in the 'grDevices' package).
The Cairo device maintains an array of clipping paths.
When a new clipping path is requested (with a call to
setClipPath) the device starts a new path
and enters an "append mode"
before it runs the R function
that defines the clipping path. Cairo device functions that perform
drawing (e.g., Cairo_Rect) only append shapes to
the current path when the device is in "append mode" (when not in
append mode, these device functions start a new path, add the shape
to the path, set
parameters like colour, then stroke and/or fill the path).
After the R function has run, the path is closed and the clipping
region is set from the path.
The path is also saved in the array of clipping paths and
an integer index to array is returned as the reference (as an
R integer vector).
The 'grid' package stores the clipping path reference that is returned,
along with the original "GridClipPath", creating a
"GridResolvedClipPath". This enhanced clipping path
object is stored in the pushed viewport so that, when a viewport
is revisited, 'grid' can send the reference to the clipping path
as well as the clipping path itself in the call to setClipPath,
which allows the graphics device to reuse cached clipping paths
(if it is set up that way).
The Cairo device checks whether the ref argument
to setClipPath is non-NULL, in which case it looks
up the relevant clipping path in its array of clipping paths
and reuses that, rather than generating a new clipping path.
'grid' releases all clipping paths on a grid.newpage.
A setMask device function has been added to allow
the graphics engine (or graphics systems) to ask a device to
define a mask. The function takes a mask
and a ref and should return a reference to
the mask on the device. All three values are SEXPs,
but all the device needs to know about the mask is that
it is an R function (with no arguments) that the device should
call to create the mask. As with clipping paths, the references are
generated by the device, passed back to the graphics engine, then
sent in again to the device. The graphics engine (or graphics
systems) only store the references and pass them back to the device;
the references only have
meaning within the graphics device.
There is also a releaseMask device function,
which takes a reference to a mask so that the graphics engine
(or graphics systems) can indicate to the device that a mask
is no longer required.
The Cairo device maintains an array of masks.
When a new mask is requested (with a call to
setMask) the device starts a new group
(cairo_push_group) so that all drawing
on the device is on a temporary surface, calls the mask function,
then saves the group as a pattern (cairo_pop_group)
on the array of masks and returns the index of the mask in that
array.
The 'grid' package stores the mask reference that is returned,
along with the original "GridMask", creating a
"GridResolvedMask". This enhanced mask
object is stored in the pushed viewport so that, when a viewport
is revisited, 'grid' can send the reference to the mask
as well as the mask itself in the call to setMask;
this allows the graphics device to reuse cached masks
(if it is set up that way).
The Cairo device also keeps track of the current Mask, as an index
into its mask array.
This starts as -1, which means there is no mask in effect.
setMask updates this index, including resetting to
-1 if sent a NULL mask.
The 'grid' package calls setMask whenever a viewport
is pushed or revisited to update the current mask on the device.
The shape-drawing functions on the Cairo device check whether
the mask is non-negative. If so, rather than drawing directly,
they draw to a temporary surface (cairo_push_group,
cairo_pop_group), collect the result as a pattern,
then mask the pattern, using the current mask, to draw on the
main device surface (cairo_mask).
pdf device
Gradients, patterns, clipping paths,
and masks have also been implemented on
the pdf graphics device.
The pdf device maintains an array of "definitions",
which are just strings of PDF code.
Resolving a gradient (via setPattern) creates
a definition that contains the PDF code defining the gradient
and the array index to that definition is returned as the
reference.
When a shape is drawn with a gradient fill, code something like
/Def3 scn is generated to indicate that definition 3
(a gradient) is to be used as the fill colour.
On dev.off, definition strings are written out at the end of
the PDF file and the link between /Def3 and the
appropriate PDF object number is resolved.
Semi-transparent gradients are a bit more complicated because
they require creating an additional "soft mask" definition.
In this case, the reference returned is two array indices, one for
the gradient and one for the soft mask.
When a shape is drawn with a semi-transparent gradient fill an
additional piece of code, something like /Def4 gs
is generated to enforce the soft mask for the gradient fill.
Again, the actual definition string for the soft mask is written
out at the end of the PDF file, when links between definition names
and object numbers are resolved.
Resolving a pattern creates a definition that contains PDF code to define the pattern, with the array index of that definition returned as a reference. The definition of a pattern contains a "stream" of drawing code, which is obtained by evaluating the R function from the pattern and capturing its output within a temporary definition (that is copied to the pattern definition and not written out itself). When a shape is drawn with a pattern fill, the pattern is set as the fill colour as for gradient fills. Pattern definitions are stored and written out at the end of the PDF file, when links between definition names and object numbers are resolved. An added complication with patterns is that the definition is actually only finalised at this point because the pattern must contain its own Resources Dictionary (it cannot just refer to the document's Resource Dictionary because that contains a reference to the pattern itself!).
Resolving a clipping path (via setClipPath) creates
a definition that contains the PDF code that draws the clipping path.
Again, the array index of that definition is returned as the reference.
The PDF code describing the clipping path is obtained by
evaluating the R function for the clipping path and capturing
the output within the clipping path definition.
The setClipPath call also writes the definition string
out (plus W n to enforce the clipping path), but
it can simply reuse the definition string (rather than regenerating it)
if the reference is not NULL.
A clipping path definition is not written out at the end of the file
(because it is written inline whenever a clipping path is set).
A limitation: the fill rule used by the clipping operator follows the device fill rule. So it is possible to add a path with one fill rule, but have the clipping path use a different fill rule.
Resolving a mask (via setMask) creates a definition
that contains the PDF code that defines the mask content.
Masks are implemented as alpha soft masks.
The mask is described by a "stream" of PDF code that is obtained
by evaluating the R function for the mask and capturing its output
within a temporary definition (as for patterns).
The array index of that definition is returned as the reference.
Mask definitions are stored and written out at the end of the PDF file,
when links between definition names and object numbers are resolved.
The PDF device monitors whether a mask is currently defined and,
when drawing normally, if a mask is defined it is enforced with
code something like /Def5 gs.
Unlike clipping paths, it is valid to nest masks within masks (and gradients and clipping paths within masks); masks are essentially self-contained drawings. This can be accommodated by the PDF device because all of these features are just stored in definitions as the mask content is captured, and then the definitions are written to file at the end, and only references to other definitions are recorded in the mask content.
The argument to augment the R graphics engine with new graphics features is a simple one: R cannot do some things now, so we should make it so it can. But how important is it to allow R to produce more sophisticated graphical output ?
One motivation for these changes is to allow people to produce more of their figures and diagrams via code. One workflow that people employ is to generate a plot using R and then use additional software, such as Adobe Illustrator, to "touch up" the plot. This sort of workflow is not automatable, or reproducible, or shareable, etc. If we can help people to do everything via code and remove manual steps from workflows, that is a big win.
Another motivation is the desire to integrate R graphics with graphics that has been produced by other graphics systems. For example, having better support for sophisticated graphical features in R would benefit work already done on importing graphics from other systems into R, such as 'grImport' (Murrell, 2009), 'grImport2' (Potter and Murrell, 2019), 'metapost' (Murrell, 2019), 'dvir' (Murrell, 2020a), and 'layoutEngine' (Murrell, 2020b). Without these features, it is not possible to represent or reproduce images from other systems properly in R.
Another piece of evidence of pent up demand is the existence of packages like 'riverplot' and 'ggpattern' that were mentioned in the Introduction. Both of these should benefit from native support for these features in the R graphics engine (while still providing benefit on graphics devices that cannot support these features themselves!). The 'gridSVG' package, which gave up entirely and just walked around the graphics engine to access these sorts of features, might also be able to return to the fold.
The design of the API for these new features has been focused on flexibility - making things possible. This is reflected particularly in the 'grid' API where clipping paths, patterns, and masks are all defined in terms of a grob. That could be as simple as a rectangle, but it could also be as complex as a facetted 'ggplot2' plot (Wickham, 2016).
This flexibility is good in the sense that it makes reasonably complex things possible (e.g., masks containing patterns and clipping paths), but it does place a reasonable burden on the graphics devices. For example, graphics devices must be written to allow for recursive calls; drawing of a shape may trigger drawing of further shapes (e.g., in order to resolve the fill pattern for the original shape).
This flexibility may also impact on efficiency. For example, it is only currently possible to specify a single pattern fill for a grob (which may draw multiple shapes); pattern fills are not vectorised.
As use-cases appear, there may be a need for adding a simpler interface for patterns, masks, and clipping paths, both to allow graphics devices to support a less flexible API (with less effort) and to allow greater efficiency when drawing a large number of shapes.
On the plus side, the current API passes an SEXP as the specification for a pattern or clipping path or mask to resolve, so it should be possible in future to pass other objects via this interface with, say, classes used to distinguish between different sorts of specifications.
Definitions are resolved every time a graphics system calls the graphics engine because the graphics engine is a "flat" coordinate system whereas the graphics systems (particularly 'grid' units) are dynamic and depend on the current drawing context.
This may present some challenges for implementing graphical definitions efficiently. The inefficiency could bite both in terms of speed and, for file-based devices, memory. However, the worst case scenario is something like filling thousands of data symbols with the same gradient fill, which 'grid' should handle by only resolving the fill once.
Another issue is revisiting viewports (up/down). This could also generate a lot of redundant recalculations (or very large file sizes). Though not at the same scale as the thousands-of-shapes problem, it could be more common. This also can happen during calculation of things like "grobWidth" units. Again, the implementation in 'grid' has been designed to allow the device to minimise the recalculations in these scenarios.
There remains some work to do to fully implement some areas of support for the new features. Some of the current gaps or limitations include:
At least partial support should be possible for some of the
remaining graphics devices in the 'grDevices' package.
For example the PostScript and Quartz systems underlying the
postscript() and quartz() devices
should allow support for at least some of the new features.
On the other hand, support is unlikely or impossible for the
windows(), pictex(), or xfig()
devices.
There is no guarantee that we can generate the same output on all R graphics devices.
This horse actually bolted a long time ago. The output on different R graphics devices has never been identical and there are already graphics features that are not supported on all R graphics devices (e.g., translucent colours are not supported on the PostScript device).
This decision is partly because not all devices will be capable of supporting the new features and partly because it makes it easy to roll out the new features; graphics devices can initially opt out of all new features and add support as and when they are able.
SEXPs in graphics devices
The design involves sending R's SEXP structures to
graphics devices.
In the early days, there was an effort to avoid using R's internal C structures within graphics devices (so that they only had to include R's graphics-related header files and they did not have to worry about complications like R's memory management).
This horse also bolted a while ago. From R 2.13.2 (at least), when the
cap graphics device procedure was added (to allow
raster "screen shots" of current device state), devices have
been able to at least return R structures.
Some of the new features require sending relatively complex information to the graphics device (e.g., gradient information and pattern information), so rather than define complex new C structures, it is easier to make use of R's existing flexible structures.
One problem is that an SEXP in C is basically an opaque pointer. The solution to this problem was to write a C API for interacting with the SEXP structures and encourage devices to use that.
This update to the graphics engine adds several new features, but more could be added.
This is related to the device-independence problem, but instead of worrying about whether output will look the same on all devices, we are concerned with accessing as much of the capabilities of the device as possible, without becoming so tied to the capabilites of one device that feature support becomes ridiculously splintered.
There are features that are only supported by some formats (e.g., SVG has filters, but Cairo has only very limited filter support, whereas Cairo has mesh patterns, but SVG does not). There are also subtleties between formats, like the 'gradientUnits' in SVG that are not supported in Cairo and PDF allows a difference range of extend options for patterns compared to Cairo.
The PDF feature set is probably the most sophisticated. For example, most graphics formats have linear and radial gradients, Cairo graphics has "mesh patterns" that SVG does not, but PDF has seven types of "shaders" (type 2=Linear gradients, 3=Radial gradients, 4&5=Gouraud-shaded triangle meshes, 6=Coons patch meshes, and 7=Tensor-product patch meshes) including Function-based shaders (type 1) that define the colour of every point in the image using a mathematical function.
The range of pattern fills could be expanded in future tp provide access to some of these more advanced features.
The new features are implemented within the graphics engine. This means that, in theory, interfaces can be made for both 'graphics' and 'grid'.
However, the R user interface has only been implemented for 'grid' so far.
This is because
'grid' allows more flexible and interesting definitions,
for example, the use of units in locating gradient stops.
'grid' also allows for things like adding features
by post-editing because we are able to address graphical
objects by name.
It is also possible in the meantime
to apply the new features to 'graphics'
output via gridGraphics::grid.echo
and functions like grid::grid.edit.
Future work could include a 'graphics' API for the new features.
Adding support for the new features has lead to an increase in modal behaviour on Cairo and PDF devices; the device can be in a normal drawing state, or capturing a clipping path, or capturing a pattern or a mask. This means that errors during drawing can leave the device in a poor state. Some effort has been made to "reset" the device on a new page. Also, warnings rather than errors have been used where possible.
Quite a large variation between PDF viewers has been observed (e.g., evince, xpdf, gs/gv, and firefox). There can also be (even bigger) variation between versions of viewers and platforms. This bites harder for more complex drawings. For example, nested tiling patterns are not handled well by gv 3.7.4, xpdf 3.04, and evince 3.18.2 on Ubuntu 16.04, but are fine in gv 3.7.4, xpdf 3.04, and evince 3.28.4 on Ubuntu 18.04.
Thanks to the CRAN group, particularly Brian Ripley, for assistance with testing and coordinating the merge of these changes into R.
Thanks also to the maintainers of several graphics device packages who have assisted with the transition to these new features.
This work was partially funded by a donation from R Studio to the University of Auckland Foundation.
The examples and discussion in this report relate to the development version of R (specifically revision 78759), which will probably become R version 4.1.0.
This report was generated within a Docker container (see Resources section below).
Murrell, P. (2020). "Catching Up with R Graphics" Technical Report 2020-04, Department of Statistics, The University of Auckland. Version 1. [ bib | DOI | http ]
1 It is actually possible to get this particular result currently in R graphics. We can generate a path consisting of the border of the entire image with the border of New Zealand inside it (i.e., a rectangular path with a hole the shape of New Zealand) and fill that with opaque white. However, that sort of workaround is more awkward and often runs into difficulties, for example, if we want to add other output to the image, but not obscure it with the opaque white fill. In general, we can generate may different graphical results just with the existing R graphics features, but we may have to work very hard to get what we want. It could be said that all that these changes provide is greater convenience, but in some cases it is much greater convenience.
This document
by Paul
Murrell is licensed under a Creative
Commons Attribution 4.0 International License.