
An OpenAPI Pipeline for NZ Crime Data by Paul Murrell is licensed under a Creative Commons Attribution 4.0 International License.
by Paul Murrell
In March 2016, the NZ Herald ran a week-long series on NZ crime data, including an interactive map, which shows the total number of crimes per region (for July 2015 to December 2015). Harkanwal Singh (Data Editor) made the crime data avaiable via github. This report describes the construction of OpenAPI pipelines to further explore the NZ Crime data.
Two previous reports have described the creation of one-off OpenAPI pipelines for CPI data and demonstrated that running an OpenAPI pipeline can be made a very simple task. This report demonstrates the creation of slightly more general-purpose OpenAPI modules and a demonstration that combining modules into a pipeline can be made a very simple task.
This section briefly explores the NZ crime data set to show what sort of information we have available and to provide an example of a simple plot that we could produce from these data.
The original crime data come from the New Zealand Police, in the form of counts of crimes per meshblock (smallest census region) per month (July 2014 to December 2015).
To associate meshblocks with recognisable regions in New Zealand, we can use the Geographic Area tables from Statistics New Zealand.
Merging these two together gives us the ability to, for example, aggregate counts of crimes per Area Unit for each month.
A plot of the monthly data for the Area Unit "Glendowie" is shown below.
This section describes the construction of some OpenAPI modules that enable others to replicate the exploration from the previous section and to perform a similar exploration for other regions in New Zealand.
The first module
downloads the NZ crime CSV file from github and creates an R data frame.
The language of this module is R code and it runs on a Docker host,
rocker/r-base.
The usefulness of making this a separate module is that the R data frame
can be a starting point for many other sorts of explorations.
The second module
downloads a zip file from the web (not from Statistics New Zealand because
they appear to have put a block on automated downloading), extracts
a CSV file from the zip file, and creates an R data frame.
The language of this module is R and it runs on rocker/r-base.
Again, the value of a separate module here is that the R data frame of
geographic area information could be useful for other purposes.
The third module
merges the NZ crime data frame with the geographic areas data frame.
The language is R and it runs on rocker/r-base.
The data frame result could be useful for a variety of explorations.
The fourth module
is very simple; it just assigns the string "Glendowie" to an R symbol.
The language is R and it runs on rocker/r-base.
The reason for this module will become clearer soon.
The fifth module
takes the merged data frame and the string "Glendowie" and
creates a plot of the number of crimes in Glendowie each month.
The language is R and it runs on rocker/r-base.
This is a specialised module in some ways because it produces a very
specific outcome (a specific plot), but it is generalised in one
sense because it accepts the region for the plot as an input.
This means that it could be used to produce plots for other regions.
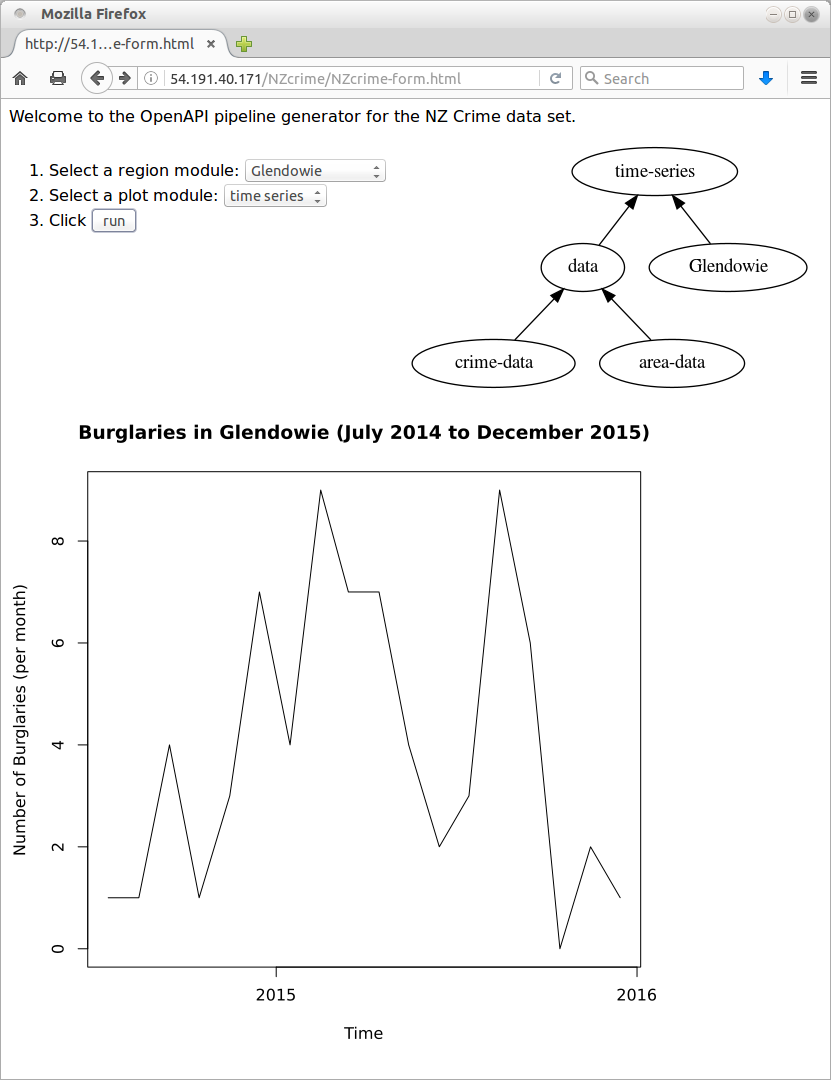
The modules described so far can be assembled into a pipeline to produce a plot of crimes per month for Glendowie. The structure of the pipeline is shown below and the plot is shown below that.


The plot module described above has the potential to produce plots of crimes per month for other regions. However, in order to take advantage of that flexibility, we need to create modules with outputs that can provide the region input for the plot module.
Fortunately, modules are just XML files, so generating a set of modules based on a simple template is just a text processing task. The 'conduit' package makes it even easier by providing module() and saveModule() functions to generate the correct XML automatically.
R code to generate modules for all Area Units starting with "Glen" is provided at the end of this report.
Actually generating a plot for a new region requires building a new pipeline, with the Glendowie region module replaced by a different one representing a different region. This is just a matter of copying and slightly altering the XML code from the original pipeline, but it can be made even easier by building, for example, a web front end.
A very basic example front end (shown below) has been created on an EC2 instance (the previous report on CPI pipelines describes the set up of this EC2 instance and how it can be recreated if it gets taken down). This interface simplifies the creation of a pipeline to the selection of items in a menu.
The OpenAPI pipelines built in this report consist of a data preparation part and a plotting part. The data preparation part is distinct in a couple of ways: it only really needs to happen once (the data are not expected to change much) and the data preparation part could be reused for other purposes besides the plot of crimes per month for a particular Area Unit. This raises two issues: can we treat the data preparation as its own pipeline; and can we just run the data preparation pipeline once and somehow "cache" the result.
It is straightforward to produce a data pipeline that consists of just the data preparation modules; this is just a subset of the complete pipeline.
The result of running an OpenAPI pipeline can be serialised as a tar ball, which is required to contain the outputs from the pipeline plus OpenAPI modules that allow us to make use of those outputs in other OpenAPI pipelines. The 'conduit' glue system provides an export() function for this purpose.
It is then straightforward to create a new pipeline that makes use of the module that represents the result of running the data pipeline. This pipeline makes use of pre-prepared data rather than having to rerun the data preparation modules. The result of running this pipeline is available as a tar ball.
This report has demonstrated the creation of some OpenAPI modules and pipelines for exploring New Zealand crime data. One important feature of these modules is that they are somewhat general-purpose. For example, several modules create R data frames from original CSV or ZIP files and those data frames may be useful for a variety of other purposes. The plot module is also general because it accepts an input that selects which New Zealand Area Unit is going to be plotted.
Another important feature of some of the modules in this report is that they are programmatically-generated. The set of modules representing different Area Units in New Zealand were created by writing an R script. This demonstrates how easy it is to generate new OpenAPI modules in bulk. In the OpenAPI architecture, modules are cheap to build, which promotes building lots of them to solve a variety of problems.
The final important feature of this report was the demonstration of a simple web interface for creating new pipelines (variations on a simple pipeline template). This shows that it is also cheap to build new OpenAPI pipelines and the construction step is simply a matter of joining modules together, which can be simplified further by providing a graphical user interface.
The idea of having a separate pipeline for the data preparation stage of our overall task raises the possibility of creating an overall pipeline that consists of the data preparation pipeline, plus a region module and a plot module. In other words, the overall pipeline has a pipeline as one of its components. This currently does not work in the 'conduit' glue system, so is an area for future development.
The OpenAPI architecture encourages solving problems by generating lots of small interconnecting components, modules and pipelines, by making it cheap and easy to create modules and pipelines. A proliferation of modules and pipelines means that it is crucial to be able to find an appropriate module or pipeline. This adds urgency to the need, already identified in a previous report, to be able to tag components, host them in public repositories, and provide search facilities for the repositories.
Although this report demonstrates an example of a simple tool for building new pipelines, all of the new pipelines adhere to the same simple template. Of more general use would be a simple interface that allowed lay users to construct pipelines of their own design.
A Herald series on New Zealand crime presented a comparison of crime rates in different regions of New Zealand. This report demonstrates the creation of a collection of OpenAPI modules and pipelines that can be used to explore the crimes per month over time for individual regions. A simple interface is provided that allows a lay user to use the modules to build a pipeline for a region of their choice.
This document demonstrates how the OpenAPI architecture can be used to create modules with some generality, how to programmatically generate modules, and an example of a simple interface for combining modules into pipelines. The system does not work perfectly, but the development of the OpenAPI architecture is ongoing.
The examples and discussion in this document relate to version 0.5 of the 'conduit' package.
This report was generated on Ubuntu 14.04 64-bit running R 3.2.3.
An OpenAPI Pipeline for NZ Crime Data
by Paul
Murrell is licensed under a Creative
Commons Attribution 4.0 International License.