http://orcid.org/0000-0002-3224-8858, Thomas Lin Pedersen, and Simon Urbanek.
by Paul Murrellhttp://orcid.org/0000-0002-3224-8858, Thomas Lin Pedersen, and Simon Urbanek.
Version 1: Saturday 06 May 2023

This document
is licensed under a Creative
Commons Attribution 4.0 International License.
This document describes a new feature in the R graphics engine to support rendering typeset glyphs. This provides a basis for developing improved text rendering in R graphics.
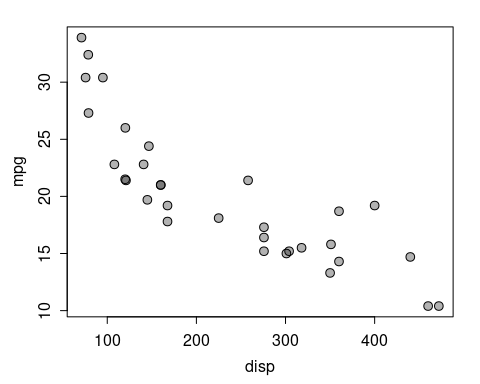
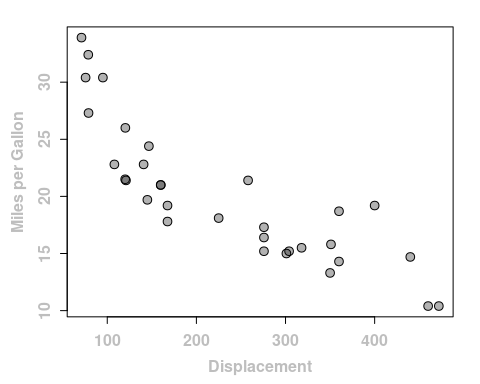
Most statistical plots contain text labels of some sort. For example, the plot below contains axis labels and tick mark labels.
plot(mpg ~ disp, mtcars, pch=21, bg=rgb(0,0,0,.3), cex=1.2)
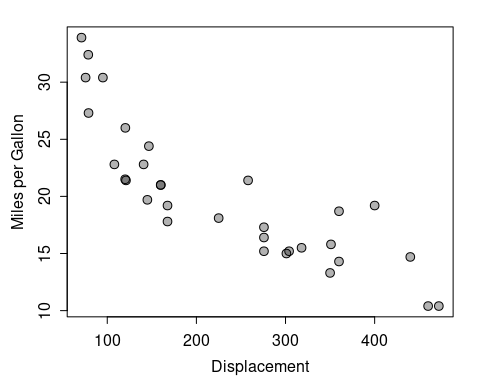
In R (R Core Team, 2023), the user can typically provide character values to customise the labels. For example, the following code provides more readable axis labels.
plot(mpg ~ disp, mtcars, pch=21, bg=rgb(0,0,0,.3), cex=1.2,
     xlab="Displacement", ylab="Miles per Gallon")
In addition, R graphics provides several graphical parameters that control the appearance of text, such as the font family, the font face, the font size, and the colour. For example, the following code makes the tick labels and the axis labels bold and grey.
plot(mpg ~ disp, mtcars, pch=21, bg=rgb(0,0,0,.3), cex=1.2,
     xlab="Displacement", ylab="Miles per Gallon",
     font.axis=2, font.lab=2, col.axis="grey", col.lab="grey")
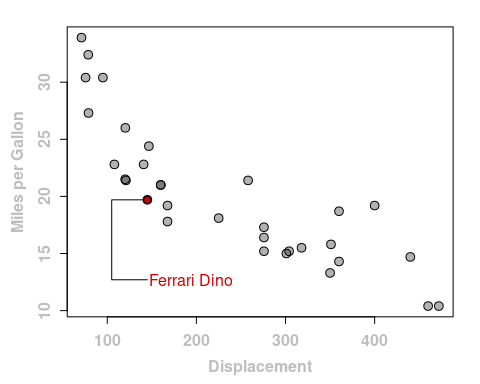
We can also draw individual text elements, with lower-level functions
like text(). For example, the following code
draws a line from the point representing the Ferrari Dino to
a label. The label is drawn using the colour
"racing red"
(rosso corsa)
and the
text is left justified relative
to the x-value of the data point (and the data point itself is drawn red).
rossoCorsa <- "#D40000"
plot(mpg ~ disp, mtcars, pch=21, bg=rgb(0,0,0,.3), cex=1.2,
     xlab="Displacement", ylab="Miles per Gallon",
     font.axis=2, font.lab=2, col.axis="grey", col.lab="grey")
lines(mtcars$disp[30] - c(0, 40, 40, 0),
      mtcars$mpg[30] - c(0, 0, 7, 7))
points(mtcars$disp[30], mtcars$mpg[30], bg=rossoCorsa, pch=21)
text(mtcars$disp[30] + 2, mtcars$mpg[30] - 7, rownames(mtcars)[30],
     col=rossoCorsa, adj=c(0))
All of the examples so far require only a very simple text-drawing model: all we need to specify is the text to draw, as a character value, where to draw it (including justification), and what font, colour, etc to use.
This model is reflected in the lowest-level user interface for
drawing text in the 'graphics' package, which is shown below:
x and y provide the location;
labels provides the text to draw;
adj, pos, and offset
are all involved in the justification of the text; and
the remaining arguments control the font and colour selection.
text(x, y = NULL, labels = seq_along(x$x),
     adj = NULL, pos = NULL, offset = 0.5,
     vfont = NULL, cex = 1, col = NULL, font = NULL, ...)
The alternative low-level graphics system, the 'grid' package, provides a similar user interface.
grid.text(label, x = unit(0.5, "npc"), y = unit(0.5, "npc"),
          just = "centre", hjust = NULL, vjust = NULL, rot = 0,
          check.overlap = FALSE, default.units = "npc",
          name = NULL, gp = gpar(), draw = TRUE, vp = NULL)
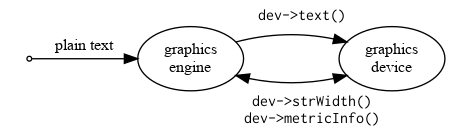
This simple text model is also reflected in the interface between
the R graphics engine and graphics devices - the interface that is used by
developers of third-party graphics devices as well as for graphics
devices provided by R itself:
x and y provide the location,
str is the text to draw,
rot is an angle to draw the text at,
hadj describes justification,
and gc contains graphical parameter settings
(colours, fonts, etc).
dev->text(double x, double y, char *str, double rot, double hadj,
          pGEcontext gc);
These interfaces are important because they place limits on what the user is able to draw (easily) with R. As a simple example of something that we cannot (easily) do with R, in the plot below we have drawn the label for the Ferrari Dino with just the word "Ferrari" in racing red and using a bold-italic font; the word "Dino" is drawn (plain) black.
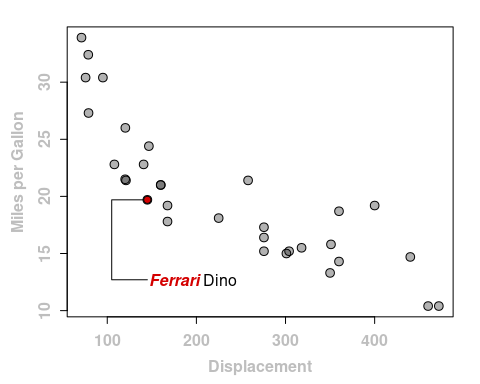
This simple modification is not (easily) possible with the text-drawing interface in R because, in the interfaces shown above, we can only specify a single colour and font face for each character value.
In addition to the limitations that the user interface imposes
on what users are able to
express with R code, the graphics device interface also limits
what graphics device authors are able to provide.
For example, the PDF language (Adobe Systems Incorporated, 2008) is perfectly capable
of changing the colour and font of a word mid-sentence or
even mid-word, but the pdf() graphics device cannot offer
that level of detail because the R graphics engine will
never request it.
This is just a simple example of the limitations of the core R graphics interface for text drawing. Some other limitations include:
Font specifications are limited to just a font family plus a font "face", where the choice is restricted to "plain", "bold", "italic", and "bold italic". We are unable to specify a numeric font "weight" (for example, CSS allows font weights from 100 to 900; World Wide Web Consortium, 2023a).
More generally, we are unable to select font variations such as condensed or access font features such as optional ligatures or number styles.
There is no support for line breaking. If we want to break text over more than one line, we must provide explicit new lines. More sophisticated typesetting, such as paragraphs with indents, are even further out of reach.
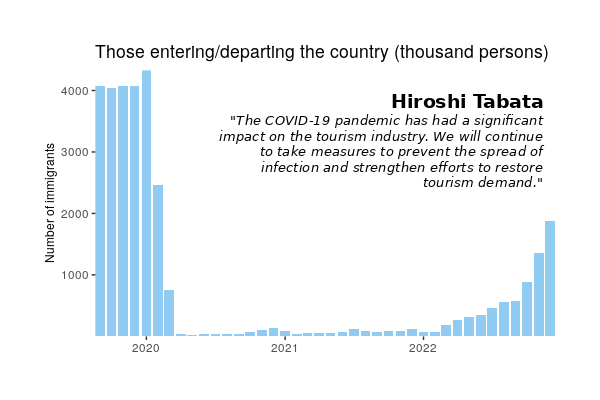
The goal of the changes to the R graphics engine that are described in this document is to provide a basis for more sophisticated text output. For example, the changes allow us (with the help of the 'textshaping' package) to layout a paragraph of text within a fixed width, with a mixture of font styles, as shown in the plot below. The plot shows the immigration statistics for Japan covering the period when the COVID pandemic began. The paragraph of text is a quote from the Japanese Minister of Land, Infrastructure, Transport and Tourism, Hiroshi Tabata.1
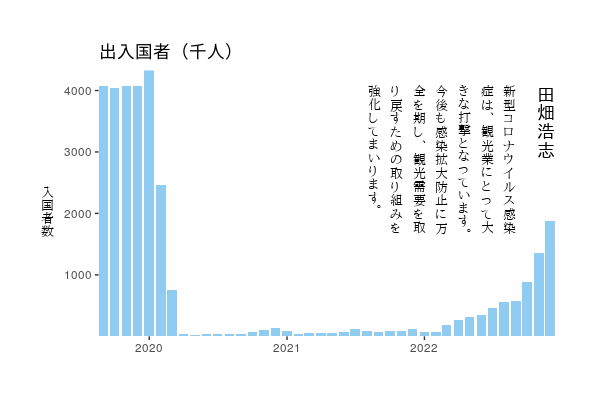
The plot below shows a more ambitious example where (with the help of the 'xdvir' package) we have added the same quote to the same plot, but this time in Japanese with the text typeset vertically (top-to-bottom and right-to-left).2 The y-axis label is also typeset vertically, which is a nice way to save horizontal space without forcing the viewer to turn their head 90 degrees.
The next section looks at what needs to happen in order to allow these more sophisticated results to be produced with R and establishes some important terminology. The Current offerings Section looks in more detail at what is currently possible with R and how close (or how far away) we are from sophisticated text output. The Section on Rendering typeset glyphs introduces the new interface that has been added to the R graphics engine (and some graphics devices) for drawing more sophisticated text. The Section on Generating typeset glyphs provides some examples of how the new interface can be built upon and then finally the Section on Integrating typeset glyphs describes additional details about the new interface.
There are two main tasks involved in more sophisticated text drawing:
Rich text input: We need to provide a way to include information about how text should be styled along with the text itself. Because the styling can change from word to word or even within a word, this typically requires some sort of markup where the styling is intermingled with the text, such as LaTeX (Lamport, 1986), HTML (WHATWG, 2023) and, to a lesser extent, markdown (Gruber, 2023). For example, the following code snippets demonstrate marked up text for both LaTeX and HTML/CSS where one word is red and the other is black (by default).
{\color{red}Ferrari} Dino
<span style="color: red">Ferrari</span> Dino
The information about styling will ideally include details about fonts, such as optional font features.
Typesetting glyphs: Given a set of rich text, we need to be able to determine which glyphs to use and where to draw them. This can become quite complex (Beingessner, 2019; Levien, 2020; World Wide Web Consortium, 2023b; World Wide Web Consortium, 2023c).
Rich text input typically involves characters, like "f" and "i", but what gets drawn are glyphs, which are shapes within a font. A simple example of the difference is the different appearance of the letters "f" and "i" in different fonts, e.g., a sans-serif font f and i versus a monospace font f and i. More complex examples inclue ligature substituion, where the two characters "f" and "i" result in a single "fi" ligature glyph.
In some circumstances, determining the placement of glyphs can be straightforward, with each glyph just drawn to the right of the previous one. However, certain combinations of glyphs may require fine adjustments known as kerning. For example, a lower-case "o" may be drawn further to the left if the preceding glyph is an upper-case "T". There is also the concept of tracking, whereby the spacing between all characters within a word are adjusted to either contract or expand the space taken up by the word. A more significant complication arises when we consider scripts other than English, where glyphs are drawn from right-to-left rather than left-to-right, and for some scripts the main text direction can be vertical rather than horizontal. Things get even more complicated if text consists of a combination of, for example, left-to-right and right-to-left text (bidirectional text).
If the text is to span more than a single line, typesetting also involves determining where to place line breaks. This can require adjustments to inter-word spacing in order to satisfy justification of the glyphs and may involve hyphenation if it is necessary to break a line in the middle of a word. Just determining possible locations for line breaks can be a challenge for some scripts that do not place any spaces between words. Further complications include things like indentation of the first line of a paragraph and the vertical spacing between lines (known as the leading of the text).
Another complication arises if the required glyphs are not available in the specified font. In this case, typesetting may involve font fallback, where the original font is replaced entirely (at least for some glyphs).
Many of these issues feed back into the issue of rich text input because information about, for example, tracking or leading requires the relevant styling parameters to be specified along with the text.
The basic text-drawing model in the Introduction was a bit of a straw man. There aleady exist several ways to get around the limitations of that model and get some of the more sophisticated text features in R.
In the simplest typesetting situations, for example a single line
of left-to-right text, all we require in order to
arrange text components next to each other
is the width of each text component.
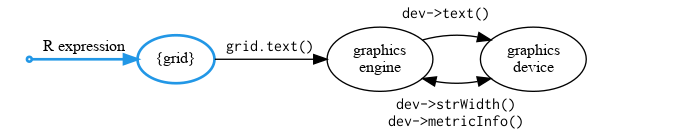
R graphics provides the strwidth() function
(and the graphics device API has dev->strWidth())
for this purpose.
In the 'grid' graphics system, there is a stringWidth()
function equivalent.
Graphics devices can also return more detailed character metrics
on a per-character basis (dev->metricInfo())
and there is a user-level interface in 'grid' (grobAscent()
and grobDescent()).
With these functions, it is possible to draw text with different styles and arrange the text components side by side. It is even possible to implement a simple line-breaking algorithm, using spaces as possible break points. For example, the following code draws the word Ferrari in racing red and bold-italic face and then the word Dino in black, with the placement of the word Dino based on the width of the word Ferrari.
ferrari <- textGrob("Ferrari ",
                    x=unit(5, "mm"),
                    just="left",
                    gp=gpar(col=rossoCorsa, fontface="bold.italic"))
grid.draw(ferrari)
grid.text("Dino",
          x=unit(5, "mm") + grobWidth(ferrari),
          just="left")

However, more sophisticated typesetting is at best a lot of additional work or else it is just not possible. For example, suppose that we want to typeset a word with a style change that occurs between two characters that would normally involve a kerning adjustment. Simply drawing the characters side by side is not a complete solution in that case.
The DIY situation is represented in the diagram below, which indicates that we can only provide blocks of plain text as input to R graphics and, while we could perform some simple arrangements of that text by querying the graphics device for text metrics, it would be very limited. In particular, we can only work with text characters, not glyphs.
In later diagrams, rich text input will be indicated by blue nodes and edges and typeset glyphs will be indicated by green nodes and edges.
The "plotmath" feature in R graphics (Murrell and Ihaka, 2000) provides both (limited) markup and (limited) typesetting for mathematical equations (based on the TeX algorithm; Knuth, 1986).
For example, the following code
describes text that involves a change in style
(the x is italic),
plus a method for inputting characters that
are otherwise difficult to type as plain text
(the word mu represents the Greek letter μ),
and non-left-to-right arrangement of text
(the μ is drawn above the 2).
grid.text(expression(italic(x) - frac(mu, 2)))

R graphics can perform the typesetting of this rich text,
including deciding on which text characters to draw (e.g.,
mu becomes μ) and calculating
where each character should be drawn (e.g., the placement of the
μ above the 2).
The diagram below indicates (with blue) that this facility does provide a form of rich text input (in the form of R expressions), although that is quite generous because the possibilities for describing the styling of the output is very limited. However, the typesetting of the resulting mathematical equation still only works with text rather than with glyphs.
The other major limitation of this facility is that it is focused only on mathematical expressions. Additionally, the typesetting only really produces a nice result if a "mathematical" font is used (e.g., the Computer Modern fonts).
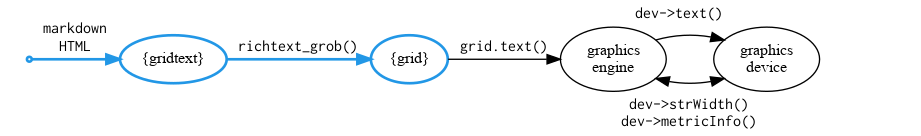
The 'gridtext' package (Wilke and Wiernik, 2022b) and its 'ggplot2' (Wickham, 2016) analogue, 'ggtext' (Wilke and Wiernik, 2022a), add basic rich text and basic typesetting on top of the standard R graphics facilities. With these packages, it is possible to describe rich text using a subset of markdown and HTML. The packages also perform the appropriate typesetting to draw the correct result. For example, the following code uses a combination of markdown and HTML (and CSS) markup to draw text with the word "Ferrari" in bold-italic red and "Dino" in black.
library(gridtext)
richtext <- '<span style="color: #D40000">***Ferrari***</span> Dino'
grid.draw(richtext_grob(richtext))

The nice thing about these packages is that they provide a convenient interface for describing rich text as well as typesetting the result. The diagram below indicates (with blue) that we again have genuine rich text input. However, the support for the markup languages in the input is only partial and the typesetting still deals in text values rather than glyphs (because of the restrictions imposed by the R graphics engine).
These packages represent a significant step up from the standard R graphics text drawing facilities. However, it is only possible to produce simple typesetting results.
The most significant contributions of the 'systemfonts' package (Pedersen et al., 2022), in terms of typesetting, are that it allows more detailed specification of fonts, including the selection of font features like optional ligatures, and it can perform font fallback, selecting a substitute font if a required glyph is not available in the user-specified font. The 'systemfonts' package also provides a typesetting facility, but that is overshadowed by the facility that is offered by its big brother, 'textshaping' (Pedersen, 2021).
The primary purpose of the 'textshaping' package is to perform typesetting. Rich text input is converted into a set of glyphs and their locations. With the help of 'systemfonts', this package handles multiple complex issues including ligatures, kerning, and text direction (including bidirectional text). The 'textshaping' package can also perform basic line breaking.
The limitation with 'textshaping' is the lack of a convenient way to describe rich text. At present, the only input format is a set of vectors of text and accompanying font information. The other problem is that R graphics cannot do anything with the raw glyph information that 'textshaping' generates. The graphics engine works with text, not glyphs.
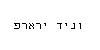
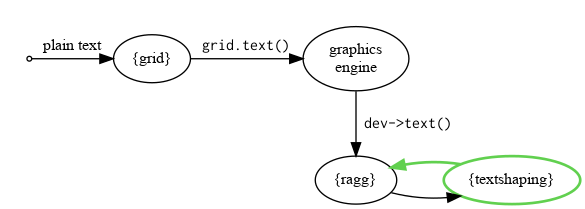
The 'ragg' package (Pedersen and Shemanarev, 2022) does not perform typesetting itself, but it provides graphics devices that make use of both 'systemfonts' and 'textshaping', so are capable of sophisticated typesetting. Even though we cannot feed rich text input to these devices (because of the limitations of the R graphics engine), we can still see glimpses of what they can do. For example, the following code draws text written in Hebrew.3 The important point about this text is that it should be written from right-to-left. Even without any rich text mark up, the 'textshaping' package can detect the correct direction of the text and typeset it appropriately.
library(ragg)
agg_png("hebrew-ragg.png", width=100, height=50, res=96)
grid.text("פרארי דינו")
dev.off()
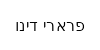
By way of contrast, the code and image below show the result of attempting to draw this text on an X11 (non-Cairo) graphics device. Notice that the Hebrew is incorrectly drawn left-to-right.
png("hebrew-x11.png", type="Xlib", width=100, height=50, res=96)
grid.text("פרארי דינו")
dev.off()
The 'ragg' package benefits from direct use of 'textshaping' because it can send text to 'textshaping' and get back raw glyph information to draw.
The diagram below indicates (with green) that the 'ragg' package graphics devices, thanks to the 'textshaping' package, are able to perform serious typesetting operations involving glyphs. The limitation here is that 'ragg' can only receive input from the R graphics engine, so it cannot work with rich text (because the graphics engine only sends plain text to graphics devices). Another issue is that this only (currently) works for the 'ragg' devices, although other graphics devices could choose to make use of 'textshaping' if they wish.
The 'dvir' package (Murrell, 2023a) is an experimental package that is not on CRAN, and has only been tested on Linux, but it is included here to provide an alternative example of a package that can perform sophisticated typesetting.
The 'dvir' package takes LaTeX code as input, which means that it can work with very rich text, and it makes use of one the main TeX engines (pdftex or luatex; Thành, 2023; The LuaTeX team, 2023) to perform typesetting, which means that it can produce a very wide range of results (including hyphenation, multi-column text, not to mention mathematical equations). For example, the following code uses LaTeX markup to draw text with the word "Ferrari" in bold-italic red and "Dino" in black.
library(dvir)
tex <-
  "\\sffamily\\definecolor{rossoCorsa}{RGB}{212,0,0}{\\color{rossoCorsa}\\bfseries\\itshape Ferrari} Dino"
grid.lualatex(tex)

The output from the TeX typesetting is a DVI file, which is essentially a set of typeset glyph information. The 'dvir' package is able to read the glyph information from a DVI file, but it then hits difficulties because R graphics cannot work with typeset glyph information. The package has to do a lot of work to turn the glyph information from a DVI file back into text so that it can feed text into R graphics functions to draw the TeX result. There are also issues with making use of the detailed font information in a DVI file (given that R graphics can only cope with a simplistic font description).
An example of the glyph-to-text problem is that, while some glyphs can be represented in text, e.g., "fi" can be expressed as a UNICODE character "\uFB01", some glyphs have no recognised representation e.g., there is no UNICODE code point for the "ti" ligature.4
The diagram below indicates (with blue and green) that the 'dvir' package, thanks to its dependence on TeX, can work with (very) rich text input that is properly typeset in terms of precisely placed glyphs. However, the 'dvir' package is hamstrung by having to convert from typeset glyph information back to text in order to work with the R graphics system.
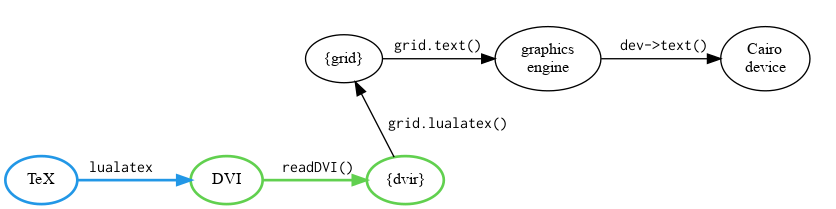
The 'dvir' package suffers from several other serious limitations, including: the dependence on a (substantial) TeX installation; the fact that the user has to write LaTeX to describe the rich text input; and the fact that 'dvir' only works with some graphics devices (e.g., the Cairo-based graphics devices).
The existing packages described above show that a lot of the necessary pieces that are required to draw more sophisticated text in R exist in one form or another. What is required in order to bring all of the pieces together?
The simple summary is that we cannot do everything we want to because the R graphics engine does not allow rich text to pass through to graphics devices and the R graphics engine does not allow typeset glyph information to pass through to graphics devices.
The obvious solutions are: allow rich text to pass through to graphics devices and/or allow typeset glyphs to pass through to graphics devices. Allowing rich text requires several issues to be resolved: What sort of rich text should be allowed and how will that be passed through? Should there be a single rich text format or should we allow multiple formats (with possibly large implications for graphics devices)? At this stage, there is no strong consensus on these issues, so we have just focused on the second part of the problem: allowing typeset glyphs to be passed through. This allows multiple rich text formats and multiple typesetting engines to be accommodated and it is a much simpler task to decide on a single structure for passing information about typeset glyphs from the R graphics engine to graphics devices.
The following section describes the new interface in R graphics that allows typeset glyph information to be passed to the graphics engine, which then passes it on to graphics devices for rendering. The Section on Generating typeset glyphs describes some early experiments with packages for generating typeset glyph information that can take advantage of this new graphics interface.
This section describes the new user interface and the new graphics device interface that allows typeset glyph information to be passed through to graphics devices.
The first step is to describe a set of typeset glyphs.
This is achieved via the grDevices::glyphInfo() function,
along with additional support from
the grDevices::glyphFont() function (at least).
glyphInfo(id, x, y, font, size, fontList,
          width, height, hAnchor, vAnchor,
          col=NA)
The id argument is a vector of glyph identifiers.
These are numeric indices into the list of glyphs within a font;
rather than specifying text to draw, we specify individual glyphs.
For example, the following ids specify the
70th, 434th, 559th, etc glyphs within a font (though not
necessarily the same font).
What those ids mean will depend entirely on the
fonts that we use.
There may be repetitions of some glyphs, e.g., the id 559
occurs several times, but only if those glyph identifiers refer to
the same font.
ids <- c(70, 434, 559, 559, 391, 559, 475, 1642, 37, 475, 510, 521)
The x and y arguments to glyphInfo()
provide the locations at which
to draw the glyphs. These locations are in points (1/72 inches).
For example, the following locations describe a horizontal, left-to-right
placement of the glyphs (the x values increase monotonically
and the y values are constant).
x <- c(0, 7.5, 15.03125, 20.140625, 25.203125, 33.484375, 38.59375,
       42.1875, 45.421875, 55.328125, 58.671875, 66.84375)
y <- rep(0, 12)
The font argument to glyphInfo()
describes the font to use, though this is only an integer
index into the fontList argument,
which contains the real font information
(see below).
The size argument to glyphInfo() is the size
at which to draw the glyphs (in points).
For example, the following font indices and sizes specify that the
first seven glyphs all come
from the same font (the first font in the
fontList) and the remaining five glyphs all come
from a different font (the second font in the fontList).
The glyphs are all at the same font size (12pt).
fonts <- rep(1:2, c(7, 5))
size <- rep(12, 12)
The fontList argument to glyphInfo()
is a list of fonts (that the font argument
refers to). Each component of the list should be constructed
using the glyphFont() function and the overall
list of fonts should be constructed using
glyphFontList().
glyphFont(file, index, family, weight, style, PSname=NA)
glyphFontList(...)
The glyphFont() function specifies a font in precise detail via
a font file, an integer index
(if the font file contains more than one font), plus
a family font name,
a numeric weight, and a character style.
For example, the following code describes two versions of
the Google font "Montserrat", one bold and italic and one plain.
These fonts are distributed as part of the 'grDevices' package.
font1 <- glyphFont(system.file("fonts", "Montserrat", "static",
                               "Montserrat-BoldItalic.ttf",
                               package="grDevices"),
                   0, "Montserrat", 700, "italic")
font2 <- glyphFont(system.file("fonts", "Montserrat", "static",
                               "Montserrat-Medium.ttf",
                               package="grDevices"),
                   0, "Montserrat", 400, "normal")
Going back to glyphInfo(), the width and
height arguments describe a bounding box around the
glyphs. These will become more relevant later, as will the
hAnchor and vAnchor arguments, which
can be left missing in simple cases
(see the Section on Integrating typeset glyphs).
The following width and height provide a bounding box for the
glyphs in our example.
width <- 74.46875
height <- 13.11719
Finally, the col argument provides a colour for
each glyph. A value of NA means that the colour
can be set at drawing time
(see the Section on Integrating typeset glyphs).
In this case, we specify that the first seven glyphs should
be drawn in racing red.
col <- rep(c(rossoCorsa, NA), c(7, 5))
We now have all that we need to create a complete set of glyph information.
The following code describes a set of twelve glyphs from two
Montserrat fonts, with the glyphs typeset horizontally from
left-to-right.
glyphs <- glyphInfo(ids, x, y, fonts, size,
                    glyphFontList(font1, font2),
                    width, height, col=col)
All we need to do now is draw the glyphs. This is achieved using the
grid::grid.glyph() function
(there is no interface for the 'graphics' package at this stage).
grid.glyph(glyphInfo,
           x = .5, y = .5, default.units = "npc",
           hjust = "centre", vjust = "centre",
           gp = gpar(), vp = NULL, name = NULL)
The only required argument to
grid::grid.glyph()
is the glyphInfo, as produced by the glyphInfo()
function. The glyphs will be drawn
by default in the centre of the current 'grid' viewport.
For example, the following code draws the set of glyphs that we
constructed above. We can now finally see that the glyphs
that we have typeset spell out "Ferrari Dino".
grid.glyph(glyphs)

The new user interface for rendering typeset glyphs is mirrored
in a new interface between the R graphics engine and graphics
devices.
This interface is slightly simpler because it only deals with
a set of glyphs that have a common font,
size, colour, and
rotation.
The font argument is an R object, with
C-level accessors provided, such as
R_GE_glyphFontFile().
dev->glyph(int n, int *glyphs, double *x, double *y,
           SEXP font, double size,
           int colour, double rot, pDevDesc dd);
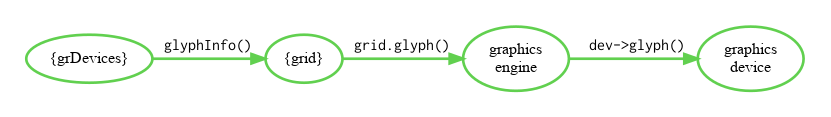
The diagram below indicates (with
green)
that the R graphics engine can now pass typeset glyph information
through to graphics devices.
So far, support for this
feature has been added to Cairo-based devices, the pdf()
device, the quartz() device, and the devices
provided by the 'ragg' package (in an
experimental fork).
The previous section described the information that can now be provided to R in order to draw typeset glyphs. We now turn to the problem of generating that typeset glyph information. How do we generate sensible glyph indices, x/y locations, and detailed font descriptions? This is the job of a "typesetting engine". R itself does not offer a typesetting engine at this stage, so this is an area where third party packages can be developed. This section looks at two packages that can already be used to provide us with typeset glyph information.
The 'textshaping' package was mentioned previously in the context of
providing typesetting support for the 'ragg' package.
The 'ragg' package only makes use of a subset of the typesetting
capabilities of the 'textshaping' package because 'ragg' is only ever
sent plain text from the graphics engine, so it can only
send plain text on to the 'textshaping' package.
However, 'textshaping' also provides an R-level interface
for typesetting text via the shape_text() function.
This interface allows us to submit a limited form of rich text, consisting of multiple text items, each with its own style (font information), plus overall layout information such as a maximum width and paragraph indenting.
The result of a call to shape_text()
is a set of typeset glyph information.
For example, the following code typesets the word
"Ferrari" and the word "Dino" using two 12pt Montserrat fonts.
library(textshaping)
shape_text(c("Ferrari", " Dino"), id=1,
           size=12,
           path=c(system.file("fonts", "Montserrat", "static",
                              "Montserrat-BoldItalic.ttf", package="grDevices"),
                  system.file("fonts", "Montserrat", "static",
                              "Montserrat-Medium.ttf", package="grDevices")),
           index=0)
  $shape
     glyph index metric_id string_id x_offset y_offset x_midpoint
  1      0    70         1         1  0.00000        0   3.750000
  2      1   434         1         1  7.50000        0   3.765625
  3      2   559         1         1 15.03125        0   2.546875
  4      3   559         1         1 20.14062        0   2.531250
  5      4   391         1         1 25.20312        0   4.140625
  6      5   559         1         1 33.48438        0   2.546875
  7      6   475         1         1 38.59375        0   1.796875
  8      0  1642         1         2 42.18750        0   1.609375
  9      1    37         1         2 45.42188        0   4.953125
  10     2   475         1         2 55.32812        0   1.671875
  11     3   510         1         2 58.67188        0   4.078125
  12     4   521         1         2 66.84375        0   3.812500

  $metrics
          string    width   height left_bearing right_bearing top_bearing bottom_bearing left_border
  1 Ferrari Dino 74.46875 26.23438      0.34375      0.515625    2.171875       2.921875           0
    top_border    pen_x pen_y
  1   11.60938 74.46875     0
As demonstrated in the previous section, the result above provides
all of the information that we need to feed the new
typeset glyph interface, glyphInfo()
and then grid.glyph(), in order to render this result.
The shape_text() function does not (yet) provide access
to all of the capabilities of the 'textshaping' package. See the
"Modern Text Features in R" blog post for more details
and examples.
The diagram below indicates (with blue and green) that we can now use 'textshaping' to input rich text (in a limited format) and produce typeset glyph information. The typeset glyphs can then pass through the graphics engine to graphics devices, both those internal to R and third-party devices.
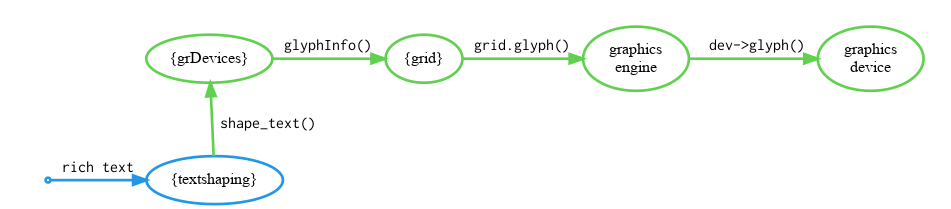
This is the workflow that was used to layout the text quote from Hiroshi Tabata within the bar plot of Japanese immigration data in the Introduction.
The 'xdvir' package (Murrell, 2023b) is an evolution of the 'dvir' package that is under active development (on github). Like 'dvir', the 'xdvir' package can read DVI files, as produced by the TeX typesetting system.
In this scenario, we can work with very rich text in the form of LaTeX code. For example, the LaTeX code below describes text with the word Ferrari in bold italic racing red and the word "Dino" in a plain font.
  \documentclass{standalone}
  \usepackage{xcolor}
  \begin{document}
  \sffamily\definecolor{rossoCorsa}{RGB}{212,0,0}{\color{rossoCorsa}\bfseries\itshape Ferrari} Dino
  \end{document}
The result of typesetting that rich text is a DVI file that contains typeset glyph information; which glyphs to draw from which fonts and where to draw them. For example, the output below shows (part of) the DVI file that is produced by typesetting the LaTeX code above (using the LuaTeX engine).
  xxx1         k=26
               x=color push rgb 0.83138 0 0
  fnt_def_1    fontnum=27, checksum=0, scale=655360, design=655360,
               fontname=[lmsans10-boldoblique]:+tlig;
  fnt_num_27
  set_char_70  'F'
  right2       b=-20316
  set_char_101 'e'
  set_char_114 'r'
  set_char_114 'r'
  set_char_97  'a'
  right2       b=-20316
  set_char_114 'r'
  set_char_105 'i'
  xxx1         k=9
               x=color pop
  right3       b=218235
  fnt_def_1    fontnum=25, checksum=0, scale=655360, design=655360,
               fontname=[lmsans10-regular]:+tlig;
  fnt_num_25
  set_char_68  'D'
  set_char_105 'i'
  set_char_110 'n'
  set_char_111 'o'
The 'xdvir' package extracts values from that DVI information
to feed into the new typeset glyph interface, glyphInfo(),
and then on to grid.glyph() to render the result.
The difference from the 'dvir' package
is that the typeset glyph information
from a DVI file can now be passed directly to R;
there is no longer a need to convert glyphs back into text
in order to make things digestible by the R graphics engine.
The diagram below indicates (with blue and green) that, with 'xdvir', we can make use of the TeX system to write rich text and to produce typeset glyph information. The typeset glyphs can then pass through the graphics engine to graphics devices, both those internal to R and third-party devices.
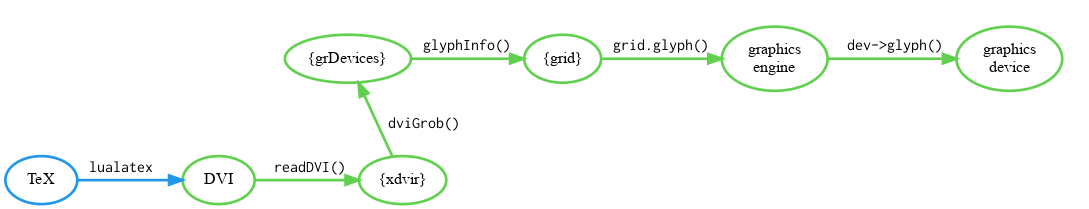
The potential value of the 'xdvir' package is very large because the TeX system can be used to perform a wide range of sophisticated typesetting tasks. For example, this workflow was used to produce the vertical Japanese text in the plot of Japanese immigration data in the Introduction. However, at the time of writing, the 'xdvir' package has only been developed to the point of demonstrating a few specific DVI files.
The examples in the Section on Rendering typeset glyphs
showed the information that is required to specify a set of
typeset glyphs.
However, that section did not address the issue of locating the
typeset glyphs within an R plot.
A call to grid.glyph() will by default just
centre the glyphs within the current 'grid' viewport.
In this section, we look at how to control the placement
of typeset glyphs in more detail.
The grid.glyph() function has arguments x
and y to specify the location of the typeset glyphs
and hjust and vjust to specify the
justification of the typeset glyphs relative to that location.
For example, the following code draws the typeset glyphs left
justified relative to the left edge of the current viewport.
grid.glyph(glyphs, x=0, hjust="left")

The horizontal justifications "left",
"centre",
and "right" (and "center")
are always available
(and "bottom" and "top" for
vertical justification),
but it is also possible to specify other "anchor" points.
This requires specifying the anchor points as part of the
call to glyphInfo() and using the glyphAnchor()
function.
In order to demonstrate the idea of different anchors, the diagram below shows a detailed view of just the typeset glyphs that spell the word "Dino". In this diagram, there are four glyphs typeset horizontally; the locations at which the glyphs are drawn - the glyph "origins" - are represented by small black dots. The blue rectangles show that each glyph has a width that determines where the subsequent glyph will be placed (modulo kerning). This leads to a simple idea of "left", the origin of the first glyph, and "right", the location where the next glyph would be placed after the last glyph, with a "centre" point half way between. These provide the basis for the default horizontal justification anchor points.
However, the red rectangles in the diagram show that each glyph also has a tight bounding box around the actual rendered extent of the glyph. The "ink" used to draw the "D" glyph only begins to the right of the glyph origin and does not extend as far to the right as the width of the glyph. This is repeated to varying degrees by the three other glyphs. This leads to the idea of other possible horizontal anchor points, such as the leftmost and rightmost positions where ink is drawn, denoted by "inkleft" and "inkright" on the diagram.
In the vertical direction, we have simple bottom and top anchor points that represent font-level bounds, akin to line height, but there are also other possible anchor points, "inkbottom" and "inktop", that are based on the tight bounding boxes of the glyphs. Another very important alternative anchor point is the "baseline" of the text; this is the y location that would be used to vertically align this text with another set of (horizontally typeset) glyphs. Note that the "inkbottom" anchor is very slightly lower than the "baseline" anchor because the bottom edge of the "o" dips a tiny amount below the baseline.
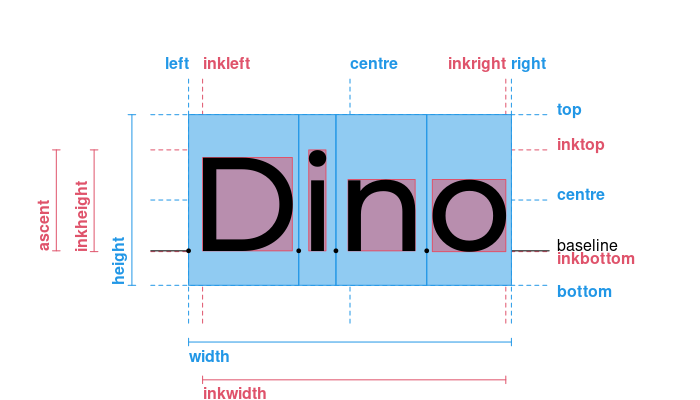
By default, the "Dino" glyphs will be centred on the current 'grid' viewport. More specifically, the "centre" horizontal anchor and the "centre" vertical anchor will be aligned with the centre of the viewport (as indicated by grey lines in the image below).
grid.glyph(dinoGlyphs)

The hAnchor and vAnchor arguments to
glyphInfo() allow additional anchor points to be
specified by supplying a call to
the glyphAnchor() function and providing both a
location and a label for each anchor point.
For example, the following code snippet shows part of a call to
glyphInfo() that
specifies multiple vertical anchors as represented in the diagram
above.
dinoGlyphs <-
    glyphInfo(...,
              vAnchor=glyphAnchor(c(fymin, vcentre, fymax,
                                    min(ymin), 0, max(ymax))*scale,
                                  label=c("bottom", "centre", "top",
                                          "inkbottom", "baseline", "inktop")),
              ...)
With those anchor points specified, we can align any of the anchor points with an x/y location within a 'grid' viewport. For example, the following code renders the "Dino" glyphs and aligns the "bottom" anchor with the vertical centre of the current viewport (indicated by a grey horizontal line).
grid.glyph(dinoGlyphs, y=.5, vjust="bottom")

The following code repeats the render, but this time aligns the "baseline" anchor with the centre of the viewport.
grid.glyph(dinoGlyphs, y=.5, vjust="baseline")

It is also possible to specify horizontal or vertical justification
as a numeric value. In this case, 0 corresponds to
left/bottom-justification, 0.5 to centre-justification, and
1 to right/top-justification.
For example, the following code renders the "Dino" glyphs
with vjust=0, which is the same as
vjust="bottom".
grid.glyph(dinoGlyphs, y=.5, vjust=0)

However, rather than being limited to a finite set of
named anchor points,
numeric justification allows us to specify any value.
For example, the following code specifies vjust=0.4.
What this means is that the y location for the glyphs will be aligned
with a position 0.4 of the way up the height of the glyphs.
grid.glyph(dinoGlyphs, y=.5, vjust=0.4)

Even greater flexibility is possible because, as well as being able
to define additional anchors as part of a set of typeset glyphs, we
can define additional widths and/or heights.
This information is supplied to the glyphInfo() call,
using the glyphWidth() and/or
glyphHeight() function
and providing width or height values, a label for each width or height, and
a label that identifies a horizontal anchor for the left of each width
(or a vertical anchor for the bottom of each height).
For example, the following code snippet shows part of a call to
glyphInfo() that
specifies multiple heights as represented in the diagram
above.
dinoGlyphs <-
    glyphInfo(...,
              height=glyphHeight(c(height, inkheight, max(ymax))*scale,
                                 label=c("height", "inkheight", "ascent"),
                                 bottom=c("bottom", "inkbottom", "baseline")),
              ...)
Given multiple heights, we can provide a numeric justification
and select the particular height that the justification is relative to
with the glyphJust() function.
For example, the following code specifies a numeric justification of
0 relative to the "ascent" height. This is equivalent to
vjust="baseline".
grid.glyph(dinoGlyphs, y=.5, vjust=glyphJust(0, "ascent"))

The following code demonstrates that, as well as selecting any value between 0 and 1, it is also possible to use numeric justifications outside the 0 to 1 range. Here we are aligning the "baseline" of the typeset glyphs one full "ascent" height above the middle of the current viewport.
grid.glyph(dinoGlyphs, y=.5, vjust=glyphJust(-1, "ascent"))

Like most 'grid' functions,
the grid.glyph() function has a gp
argument for setting graphical parameters such as colour and line type.
However, grid.glyph() ignores most graphical parameter
settings because they have already been determined for the typeset
glyphs. In particular, fontfamily,
fontface, and fontsize have no effect
on typeset glyphs.
The one exception is the col (colour) setting.
The col argument to glyphInfo can
contain NA values, in which case, the colour
of the glyphs will be taken from the gp setting
in grid.glyph() (or the current inherited settings).
For example, the glyphs that we constructed
in the Section on Rendering typeset glyphs specifed the colour
rossoCorsa for the first seven glyphs, but
NA for the last five glyphs.
In the following code, we render those glyphs again, specifying
col="grey", so the last five glyphs are all drawn
grey.
grid.glyph(glyphs, gp=gpar(col="grey"))

This document describes the addition of an R graphics interface for rendering typeset glyphs. This is largely groundwork for others to build upon. There are two large problems to still resolve: an interface that allows the user to enter rich (marked up) text; and a typesetting engine that can layout the rich text to produce a set of typeset glyphs. The packages 'textshaping' and 'xdvir' that are mentioned in this document are examples of the sort of development that can now take place to bring sophisticated text layout to R.
For users and developers wanting to experiment with the new capabilities, there are several important limitations:
Support for dev->glyph() has only been implemented
so far for Cairo-based graphics devices and the pdf()
and quartz() devices.
A proof-of-concept has also been developed for the 'ragg' package, but only in an experimental fork.
The pdf() support does not embed fonts.
Some PDF viewers (e.g., ghostscript; Artifex Software Inc., 2023) may cope
with this, but a more reliable result will be obtained by
embedding the fonts with the grDevices::embedGlyphs()
utility.
Support is unlikely or impossible for some graphics devices. For example, the 'svglite' graphics device (Wickham et al., 2022), due to the nature of the underlying SVG language, does not have the ability to render individual glyphs.
Glyph rendering may only work for True Type and Open Type fonts. That is certainly true for the Cairo-based devices, with Cairo graphics having dropped support for Type 1 fonts.
The device support has not been optimised at all at this stage. For example, there is no caching of loaded fonts on Cairo or Quartz devices.
R objects containing glyph information, as generated by
glyphInfo(), include fixed file paths to font files.
This means that they are not portable across different
computer environments. This portability issue infects
glyphGrob() objects by association.
The workflow from rich text input to rendered glyphs is expected to take place within the same R session and on a single hardware environment.
The examples and discussion in this report relate to R version 4.3.0, plus the following packages: 'dvir' version 0.4-0 (experimental "glyphs" branch); 'textshaping' version 0.3.6; 'ragg' version 1.2.5; 'gridtext' version 0.1.5; and 'xdvir' version 0.0-1.
This report was generated within a Docker container (see Resources section below).
1 This quote was made during a press conference on January 6, 2022, although that information was generated in a conversation with ChatGPT, so it is not clear that this quote is real; it could have been constructed by ChatGPT. The Japanese version of the quote was also generated by ChatGPT so there is no claim made as to its accuracy, though Google Translate suggests that it is not too far from sensible.
2 The data for this plot was taken from the Statistics Bureau of Japan via their Statistics Dashboard, which has both an English and Japanese version. The title and y-axis label were also copied from those sites so they are presumably reasonable translations of the English (and vice versa).
3 This is a Google Translate translation of "Ferrari Dino" into Hebrew. I have no ability to read or write Hebrew, so I can only apologise for what Google Translate has produced.
4 And apparently ligatures like it never will be added to UNICODE.
This work was partly funded by a donation from R Studio to the University of Auckland Foundation.
Murrell, P., Pedersen, T. L., and Urbanek, S. (2023). "Rendering Typeset Glyphs in R Graphics", Technical Report 2023-01, Department of Statistics, The University of Auckland. Version 1. [ bib | DOI | http ]
This document
by Paul
Murrell is licensed under a Creative
Commons Attribution 4.0 International License.