The Data Expo data set consists of seven atmospheric measurements at locations on a 24 by 24 grid averaged over each month for six years (72 time points). The elevation (height above sea level) at each location is also included in the data set (see Section 5.2.8 for more details).
The data set was originally provided as 505 plain text files, but the data can also be stored in a database with the following structure (see Section 5.6.5).
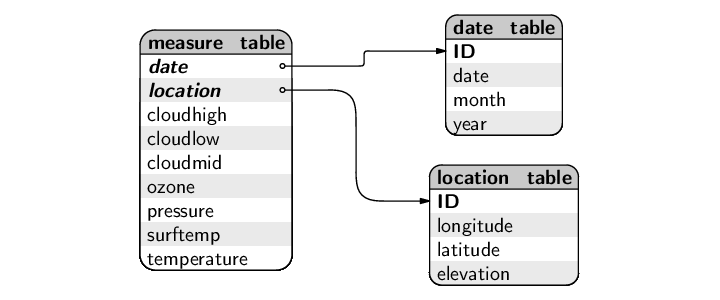
date_table ( ID [PK], date, month, year )

location_table ( ID [PK],
                 longitude, latitude, elevation )

measure_table ( date [PK] [FK date_table.ID],
                location [PK] [FK location_table.ID],
                cloudhigh, cloudlow, cloudmid, ozone,
                pressure, surftemp, temperature )
The location_table contains all of the geographic locations at which measurements were taken, and includes the elevation at each location.
ID  longitude  latitude  elevation
--  ---------  --------  ---------
1   -113.75    36.25     1526.25
2   -111.25    36.25     1759.56
3   -108.75    36.25     1948.38
4   -106.25    36.25     2241.31
...
The date_table contains all of the dates at which measurements were taken. This table also includes the text form of each month and the numeric form of the year. These have been split out to make it easier to perform queries based on months or years. The full dates are stored using the ISO 8601 format so that alphabetical ordering gives chronological order.
ID  date        month     year
--  ----------  --------  ----
1   1995-01-16  January   1995
2   1995-02-16  February  1995
3   1995-03-16  March     1995
4   1995-04-16  April     1995
...
The measure_table contains all of the atmospheric measurements for all dates and locations. Dates and locations are represented by simple ID numbers, referring to the appropriate complete information in the date_table and location_table. In the output below, the column names have been abbreviated to save space.
loc  date  chigh  cmid  clow  ozone  press  stemp  temp
---  ----  -----  ----  ----  -----  -----  -----  -----
1    1     26.0   34.5  7.5   304.0  835.0  272.7  272.1
2    1     23.0   32.0  7.0   306.0  810.0  270.9  270.3
3    1     23.0   32.0  7.0   306.0  810.0  270.9  270.3
4    1     17.0   29.5  7.0   294.0  775.0  269.7  270.9
...
With the data stored in this way, how difficult is it to extract information?
Some things are quite simple. For example, it is straightforward to extract all of the ozone measurements from the measure_table. The following SQL code performs this step.
> SELECT ozone FROM measure_table; ozone ----- 304.0 306.0 306.0 294.0 ... |
Throughout this chapter, examples of SQL code will be displayed like this, with the SQL code preceded by a prompt, >, and the output from the code--the data that have been extracted from the database--displayed below the code, in a tabular format.
This information is more useful if we also know where and when each ozone measurement was taken. Extracting this additional information is also not difficult because we can just ask for the location and date columns as well.
> SELECT date, location, ozone FROM measure_table; date location ozone ---- -------- ----- 1 1 304.0 1 2 306.0 1 3 306.0 1 4 294.0 ... |
Unfortunately, this is still not very useful because a date or location of 1 does not have a clear intuitive meaning. What we need to do is combine the values from the three tables in the database so that we can, for example, resolve the date value 1 to the corresponding real date 1995-01-16.
This is where the extraction of information from a database gets interesting--when information must be combined from more than one table.
In the following code, we extract the date column from the date_table, the longitude and latitude from the location_table, and the ozone from the measure_table. Combining information from multiple tables like this is called a database join.
> SELECT dt.date date,
            lt.longitude long, lt.latitude lat,
            ozone
         FROM measure_table mt
             INNER JOIN date_table dt
                 ON mt.date = dt.ID
             INNER JOIN location_table lt
                 ON mt.location = lt.ID;
date         long     lat    ozone
-----------  -------  -----  -----
1995-01-16   -113.75  36.25  304.0
1995-01-16   -111.25  36.25  306.0
1995-01-16   -108.75  36.25  306.0
1995-01-16   -106.25  36.25  294.0
...
This complex code is one of the costs of having data stored in a database, but if we learn a little SQL so that we can do this sort of fundamental task, we gain the benefit of the wider range of capabilities that SQL provides. As a simple example, the above task can be modified very easily if we want to only extract ozone measurements from the first location (the difference is apparent in the result because the date values change, while the locations remain the same).
> SELECT dt.date date,
            lt.longitude long, lt.latitude lat,
            ozone
         FROM measure_table mt
             INNER JOIN date_table dt
                 ON mt.date = dt.ID
             INNER JOIN location_table lt
                 ON mt.location = lt.ID
         WHERE mt.location = 1;
date         long     lat    ozone
-----------  -------  -----  -----
1995-01-16   -113.75  36.25  304.0
1995-02-16   -113.75  36.25  296.0
1995-03-16   -113.75  36.25  312.0
1995-04-16   -113.75  36.25  326.0
...
In this chapter we will gain these two useful skills: how to use SQL to perform necessary tasks with a database--the sorts of things that are quite straightforward with other storage formats--and how to use SQL to perform tasks with a database that are much more sophisticated than what is possible with other storage options.
Paul Murrell

This work is licensed under a Creative Commons Attribution-Noncommercial-Share Alike 3.0 New Zealand License.