 |
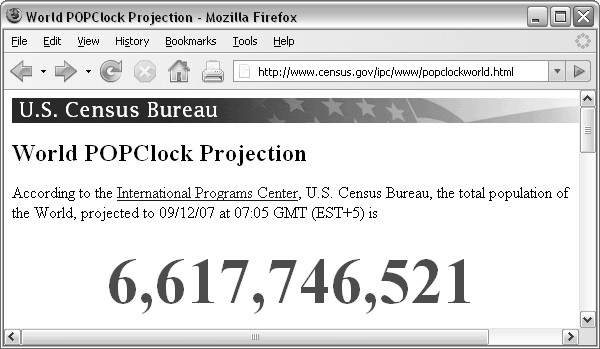
The U.S. Census Bureau maintains a web site called the World Population Clock (see Figure 9.2).
|
This web site provides an up-to-the-minute snapshot of the world's population, based on estimates by the U.S. Census Bureau. It is updated every few seconds.
In this case study, we will use this clock to generate a rough estimate of the current rate of growth of the world's population.
We will perform this task by taking two snapshots of the World Population Clock, ten minutes apart, and then we will divide the change in population by the change in time.
The purpose of this section is to look at the steps involved in detail, noting how we might perform this task “by hand”, and then looking at how we might use the computer to do the work instead. This will allow us to see what sorts of tasks we can expect a computer to be able to perform and will begin to introduce some of the programming concepts involved.
This is very easy to do by hand; we simply navigate a web browser to the population clock web page and type out, cut-and-paste, or even just write down the current population value.
What about getting the computer to do the work?
Navigating to a web page and downloading the information is not actually very difficult. This is an example of interacting with the network component of the computing environment. Downloading a web page is something that we can expect any modern programming language to be able to do, given the appropriate URL (which is visible in the “navigation bar” of the web browser in Figure 9.2).
The following R code will perform this data import task.
> clockHTML <-
    readLines("http://www.census.gov/ipc/www/popclockworld.html")
|
We will not focus on understanding all of the details of the examples of R code in this section--that is the purpose of the remainder of this chapter. The code is just provided here as concrete evidence that the task can be done and as a simple visual indication of the level of effort and complexity involved.
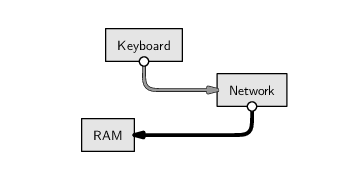
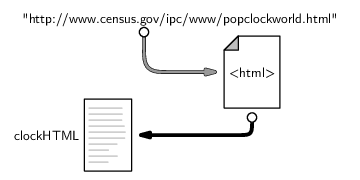
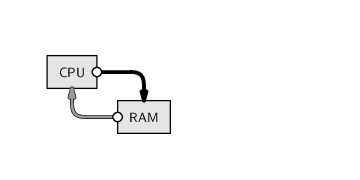
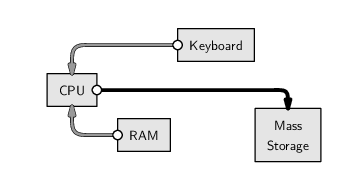
Conceptually, the above code says “read the HTML code from the network location given by the URL and store it in RAM under the name clockHTML.” The images below illustrate this idea, showing how the information that we input at the keyboard (the URL) leads to the location of a file containing HTML code on the network, which is read into RAM and given the name clockHTML. The image on the left shows the main hardware components involved in this process in general and the image on the right shows the actual data values and files involved in this particular example. We will use diagrams like this throughout the chapter to illustrate which hardware components we are dealing with when we perform different tasks.
It is important to realize that the result of the R code above is not a nice picture of the web page like we see in a browser. Instead, we have the raw HTML code that describes the web page (see Figure 9.3).
This is actually a good thing because it would be incredibly difficult for the computer to extract the population information from a picture.
|
<!DOCTYPE html PUBLIC "-//W3C//DTD XHTML 1.0 Transitional//EN"
    "http://www.w3.org/TR/xhtml1/DTD/xhtml1-transitional.dtd">
<html xmlns="http://www.w3.org/1999/xhtml"
      xml:lang="en" lang="en">
<head>
    <title>World POPClock Projection</title>
    <link rel="stylesheet"
          href="popclockworld%20Files/style.css"
          type="text/css">
    <meta name="author" content="Population Division">
    <meta http-equiv="Content-Type"
          content="text/html; charset=iso-8859-1">
    <meta name="keywords" content="world, population">
    <meta name="description"
          content="current world population estimate">
    <style type="text/css">
        #worldnumber {
	    text-align: center;
	    font-weight: bold;
	    font-size: 400%;
	    color: #ff0000;
        }
    </style>
</head>
<body>
    <div id="cb_header">
    <a href="http://www.census.gov/">
    <img src="popclockworld%20Files/cb_head.gif"
         alt="U.S. Census Bureau"
         border="0" height="25" width="639">
    </a>
    </div>

    <h1>World POPClock Projection</h1>

    <p></p>
    According to the <a href="http://www.census.gov/ipc/www/">
    International Programs Center</a>, U.S. Census Bureau,
    the total population of the World, projected to 09/12/07
    at 07:05 GMT (EST+5) is<br><br>
    <div id="worldnumber">6,617,746,521</div>
    <p></p>
    <hr>
...
|
The HTML code is better than a picture because the HTML code has a clear structure. If information has a pattern or structure, it is much easier to write computer code to navigate within the information. We will exploit the structure in the HTML code to get the computer to extract the relevant population value for us.
However, before we do anything with this HTML code, it is worth taking note of what sort of information we have. From Chapter 2, we know that HTML code is just plain text, so what we have downloaded is a plain text file. This means that, in order to extract the world population value from the HTML code, we will need to know something about how to perform text processing. We are going to need to search within the text to find the piece we want, and we are going to need to extract just that piece from the larger body of text.
The current population value on the web page is contained within the HTML code in a div tag that has an id attribute, with the unique value "worldnumber" (line 41 in Figure 9.3). This makes it very easy to find the line that contains the population estimate because we just need to search for the pattern id="worldnumber". This text search task can be performed using the following code:
> popLineNum <- grep('id="worldnumber"', clockHTML)
|
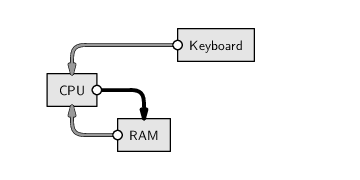
This code says “find the line of HTML code that contains the text id="worldnumber" and store the answer in RAM under the name popLineNum.” The HTML code is fetched from RAM, we supply the pattern to search for by typing it at the keyboard, the computer searches the HTML code for our pattern and finds the matching line, and the result of our search is stored back in RAM.
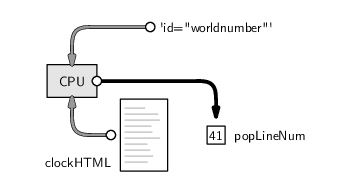
We can see the value that has been stored in RAM by typing the appropriate name.
> popLineNum
[1] 41
|
Notice that the result this time is not text; it is a number representing the appropriate line within the HTML code.
Also notice that each time we store a value in RAM, we provide a label for the value so that we can access the value again later. We stored the complete set of HTML code with the label clockHTML, and we have now also stored the result of our search with the label popLineNum.
What we want is the actual line of HTML code rather than just the number telling us which line, so we need to use popLineNum to extract a subset of the text in clockHTML. This action is performed by the following code.
> popLine <- clockHTML[popLineNum]
|
Again, this task involves using information that we already have in RAM to calculate a new data value, and we store the new value back in RAM with the label popLine.
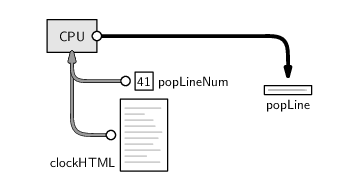
As before, we can just type the name to see the value that has been stored in RAM. The new value in this case is a line of text.
> popLine
[1] " <div id=\"worldnumber\">6,617,746,521</div>"
|
In many of the code examples throughout this chapter, we will follow this pattern: in one step, calculate a value and store it in RAM, with a label; then, in a second step, type the name of the label to display the value that has been stored.
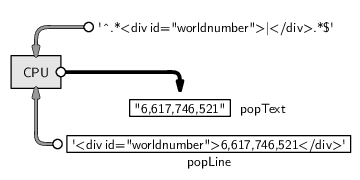
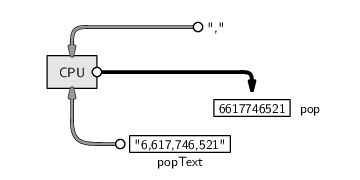
Now that we have the important line of HTML code, we want to extract just the number, 6,617,746,521, from that line. This task consists of getting rid of the HTML tags. This is a text search-and-replace task and can be performed using the following code:
> popText <- gsub('^.*<div id="worldnumber">|</div>.*$',
                   "", popLine)
> popText
[1] "6,617,746,521"
|
This code says “delete the start and end div tags (and any spaces in front of the start tag)”. We have used a regular expression, , to specify the part of the text that we want to get rid of, and we have specified "", which means an empty piece of text, as the text to replace it with.
Section 9.9 describes text processing tasks and regular expressions in more detail.
At this point, we are close to having what we want, but we are not quite there yet because the value that we have for the world's population is still a piece of text, not a number. This is a very important point. We always need to be aware of exactly what sort of information we are dealing with. As described in Chapter 5, computers represent different sorts of values in different ways, and certain operations are only possible with certain types of data. For example, we ultimately want to be able to perform arithmetic on the population value that we are getting from this web site. That means that we must have a number; it does not make sense to perform arithmetic with text values.
Thus, the final thing we need to do is turn the text of the population estimate into a number so that we can later carry out mathematical operations. This process is called type coercion and appropriate code is shown below.
> pop <- as.numeric(gsub(",", "", popText))
> pop
[1] 6617746521
|
Notice that we have to process the text still further to remove the commas that are so useful for human viewers but a complete distraction for computers.
And now we have what we were after: the current U.S. Census Bureau estimate of the world's population from the World Population Clock web site.
This first step provides a classic demonstration of the difference between performing a task by hand and writing code to get a computer to do the work. The manual method is simple, requires no new skills, and takes very little time. On the other hand, the computer code approach requires learning new information (it will take substantial chunks of this chapter to explain the code we have used so far), so it is more difficult and takes longer (the first time). However, the computer code approach will pay off in the long run, as we are about to see.
Doing nothing is about as simple as it gets for a do-it-yourself task. However, it highlights two of the major advantages of automating tasks by computer. First, computers will perform boring tasks without complaining or falling asleep, and, second, their accuracy will not degrade as a function of the boredom of the task.
The following code will make the computer wait for 10 minutes (600 seconds):
> Sys.sleep(600)
|
This is the same as the first task. If we do it by hand, it is just as easy as it was before, though tasks like this quickly become tiresome if we have to repeat them many times.
What about doing it by computer code?
Here we see a third major benefit of writing computer code: once code has been written to perform a task, repetitions of the task become essentially free. All of the pain of writing the code in the first place starts to pay off very rapidly once a task has to be repeated. Almost exactly the same code as before will produce the new population clock estimate.
> clockHTML2 <-
    readLines("http://www.census.gov/ipc/www/popclockworld.html")
|
> popLineNum2 <- grep('id="worldnumber"', clockHTML2)
> popLine2 <- clockHTML2[popLineNum2]
> popText2 <- gsub('^.*<div id="worldnumber">|</div>.*$',
"", popLine2)
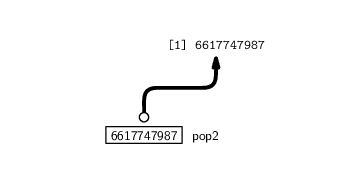
> pop2 <- as.numeric(gsub(",", "", popText2))
> pop2
|
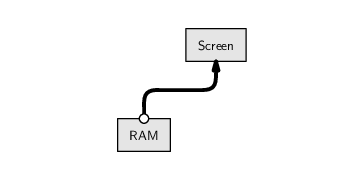
[1] 6617747987
One detail that we have ignored to this point is the fact that the results of our calculations are being printed out. The information that we have stored in RAM is being displayed on the screen. As this example suggests, there may be differences between the value that is stored in memory and what is actually displayed for human eyes; in this case, the computer displays an “index”, [1], in front of the number. This is another important point to be aware of as we proceed through this chapter.
This is a very simple calculation that is, again, easy to do by hand. But arithmetic like this is just as easy to write code for. All we need to do is divide the change in population by the elapsed time (10 minutes):
> rateEstimate <- (pop2 - pop)/10
> rateEstimate
|
[1] 146.6
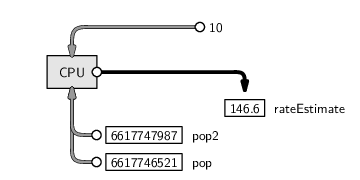
The final result is this: at the time of writing, we estimate that the world population was growing at the rate of about 147 people every minute.
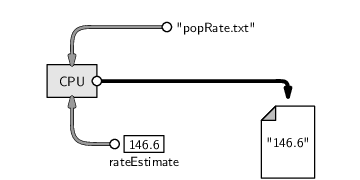
As a final step, it would be prudent to save this result in a more permanent state, by writing this information to more permanent computer memory. The values that are in RAM will disappear when we quit from R. The following code creates a new text file and stores our rate estimate in that file.
> writeLines(as.character(rateEstimate),
              "popRate.txt")
|
Notice that, in this step, we start with a number and convert it to a text value so that it can be stored as part of a text file.
To reiterate, although that may seem like quite a lot of work to go through to perform a relatively simple task, the effort is worth it. By writing code so that the computer performs the task, we can improve our accuracy and efficiency, and we can repeat the task whenever we like for no additional cost. For example, we might want to improve our estimate of the population growth rate by taking several more snapshots from the population clock web site. This would take hours by hand, but we have most of the code already, and with a little more knowledge we could set the computer happily working away on this task for us.
This chapter is concerned with writing code like this, using the R language, to conduct and automate general data handling tasks: importing and exporting data, manipulating the shape of the data, and processing data into new forms.
In the following sections, we will begin to look specifically at how to perform these tasks in R.
Paul Murrell

This work is licensed under a Creative Commons Attribution-Noncommercial-Share Alike 3.0 New Zealand License.