New Results
Detection of Multiple EMRIs
Parallel MCMC (Non-MPI) Results
A dataset was generated by mixing two different EMRIs into LISA Simulator noise and then parallel MCMC chains were run to recover them back. One signal was generated with a parameter set from Round 4 keys, while the other signal is Round 1B.3.2. Two chains were then run in parallel fashion, one of which is sampling from a very highly tempered likelihood and the other was sampling from original or cold chain. Swapping was disabled because it was useless in this case of very different likelihoods' temperatures. This is because I wanted to see as to what happens if we use quite a high temprature. I ran only two chains in a view to follow up them fast and the easy availability of two cores local machines. The following plots are self explanatory. In each figure of density plots the last plot is of SNR values which is also given in a seperate figure for each signal.
Updated: First Signal : Round 1B.3.2
The recovery results for the first signal are given in the following figures. Figure 1 shows the density plots of cold (original or actual likelihood) chain while Figure 2 shows the density plots of hot (tempered likelihood) chain, Figure 3 shows the combind plots of hot and cold chains whereas Figure 4 is a large version of the last plot in Figure 2, showing the combind SNR of cold and hot chains. Ignore the SNR plot in Figure 1.
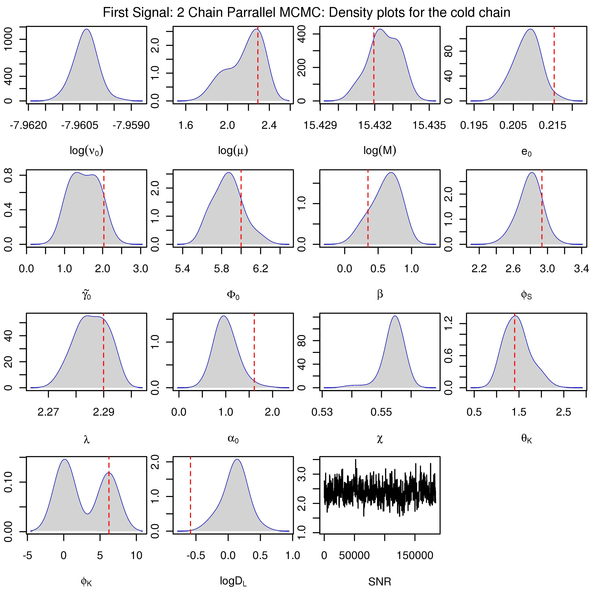
Figure 1. Density plots for the cold chain. For PDF format click on figure.
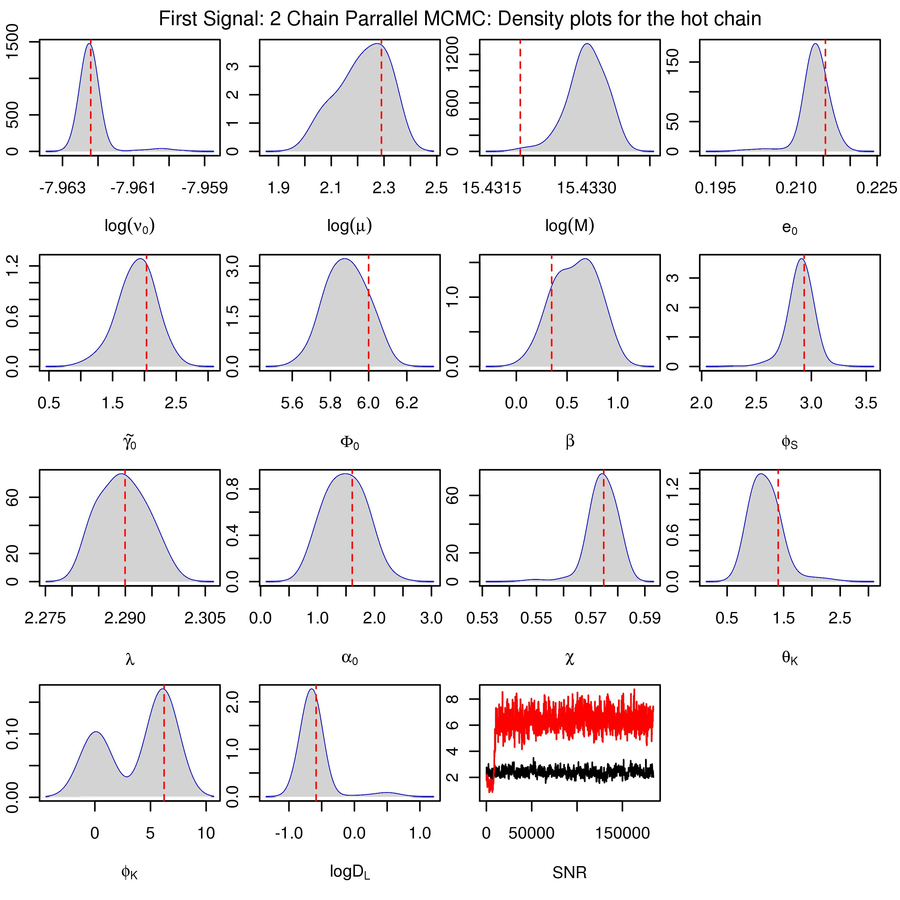
Figure 2. Density plots for the hot chain. For PDF format click on figure.
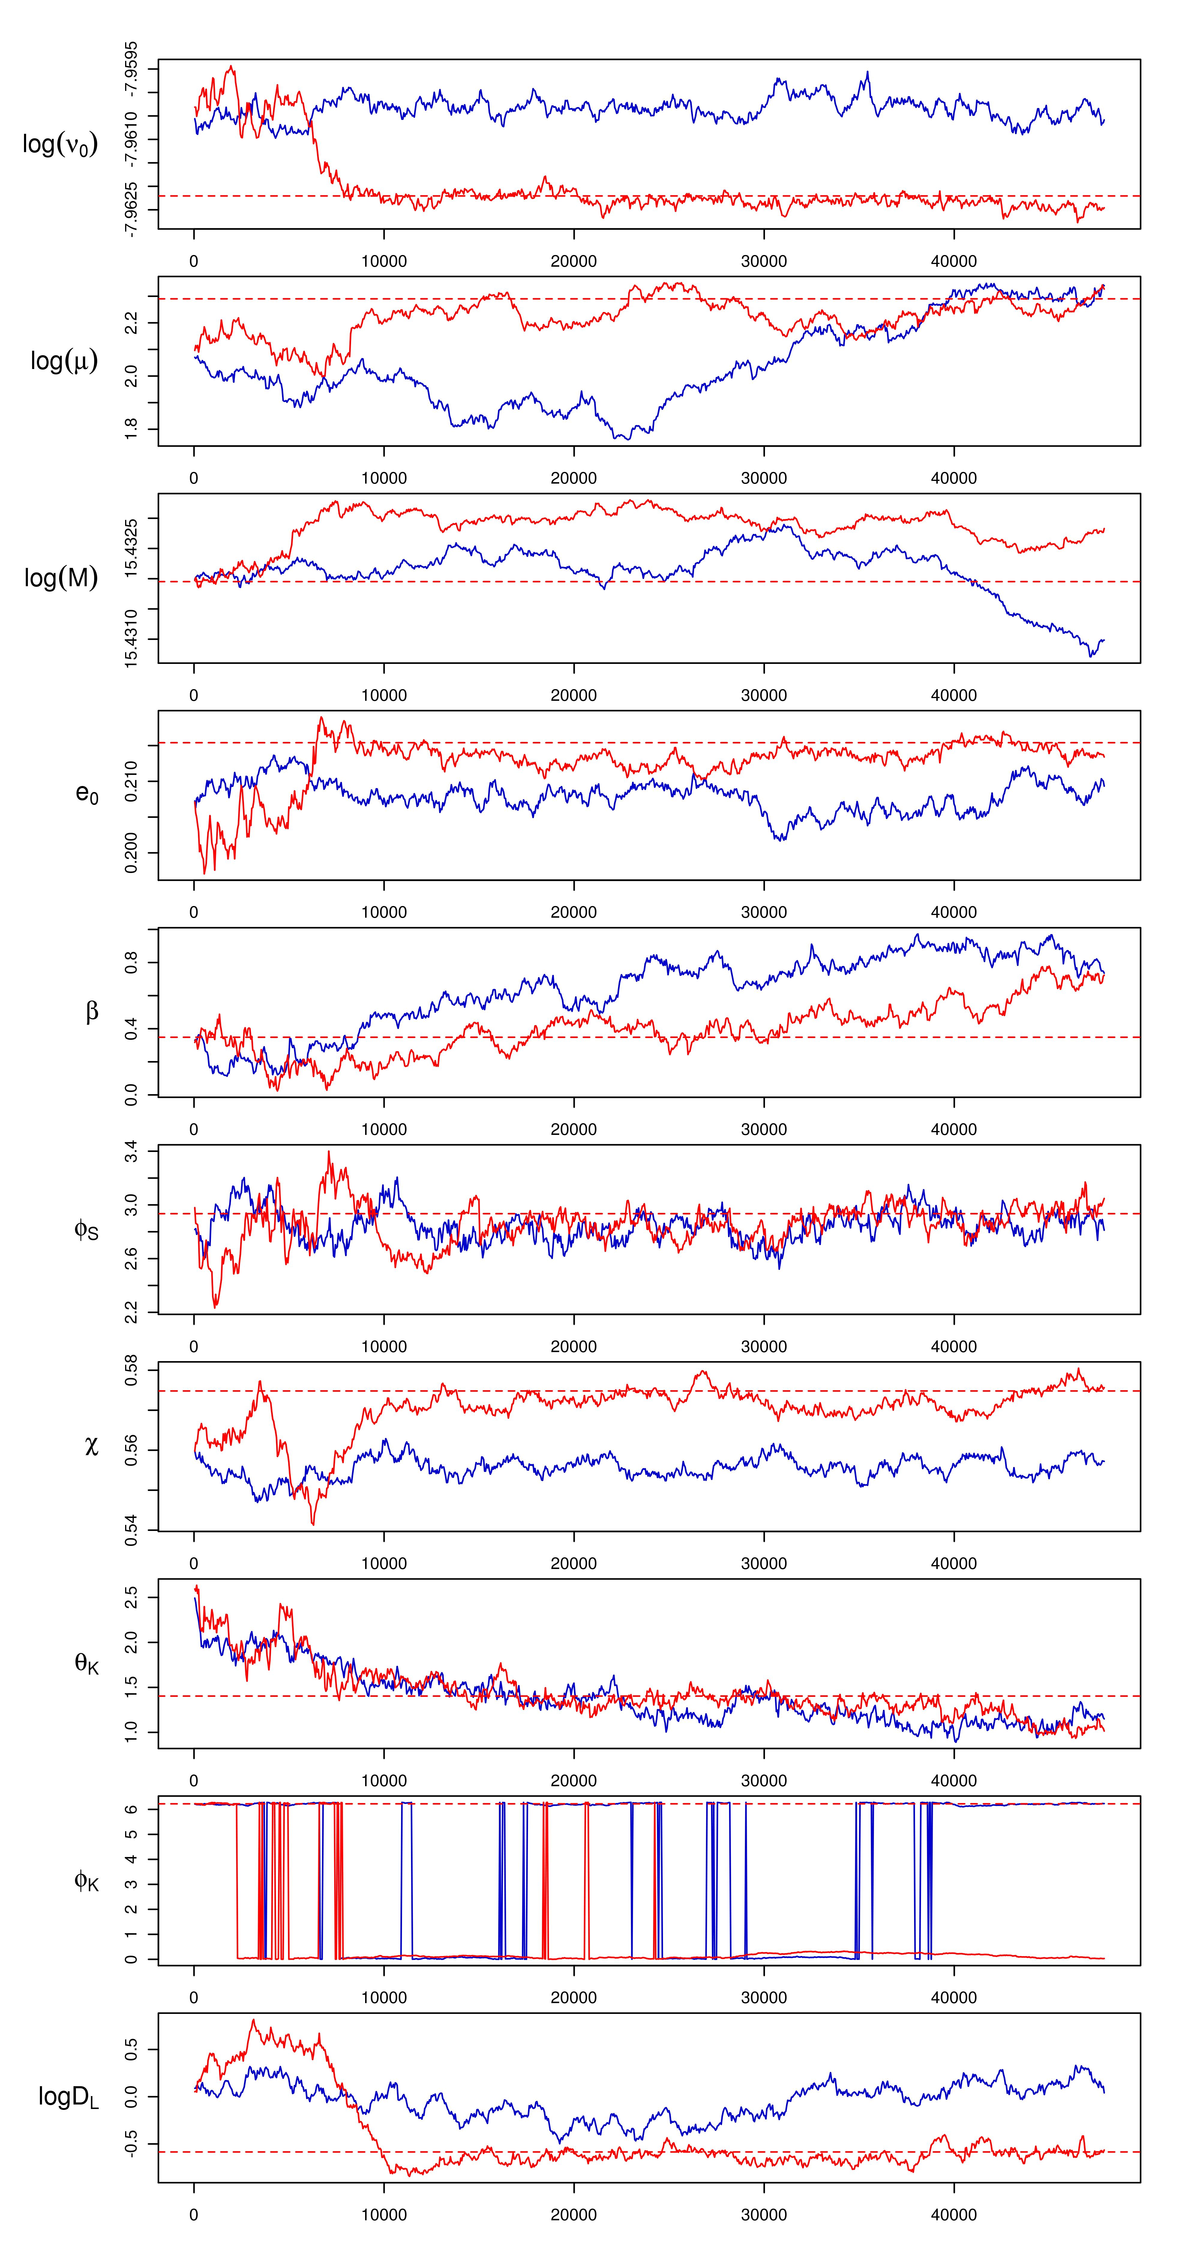
Figure 3. Combind trace plots of both cold (blue) and hot (red) chains. For PDF format click on figure.
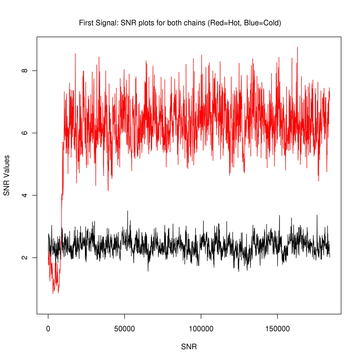
Figure 4. Combind plots of SNR of both chains (black=cold, red=hot). For PDF format click on figure.
Second Signal : Round 4
The recovery results for the second signal are given in the following figures. Figure 1 shows the density plots of cold (original or actual likelihood) chain while Figure 2 shows the density plots of hot (tempered likelihood) chain, Figure 3 shows the combind plots of hot and cold chains whereas Figure 4 is a large version of the last plot in Figure 2, showing the combind SNR of cold and hot chains.
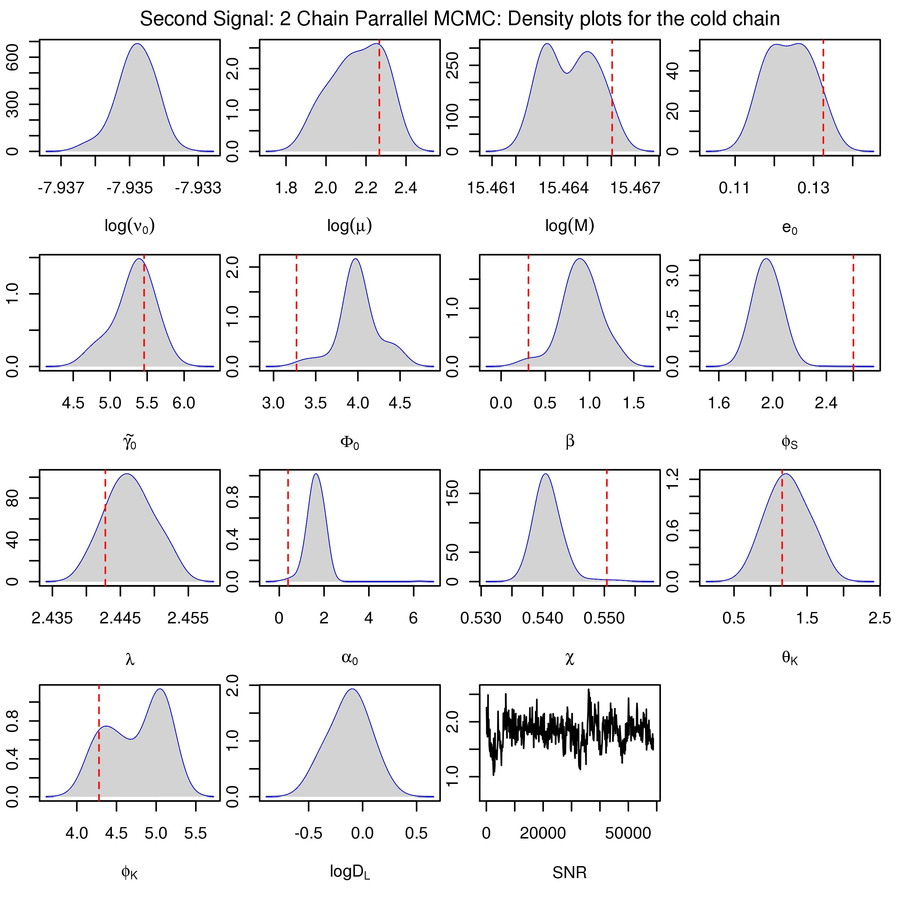
Figure 1. Density plots for the cold chain. For PDF format click on figure.
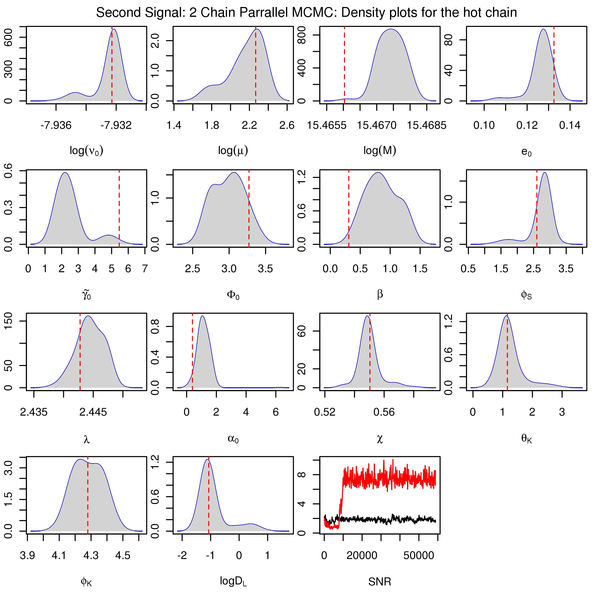
Figure 2. Density plots for the hot chain. For PDF format click on figure.
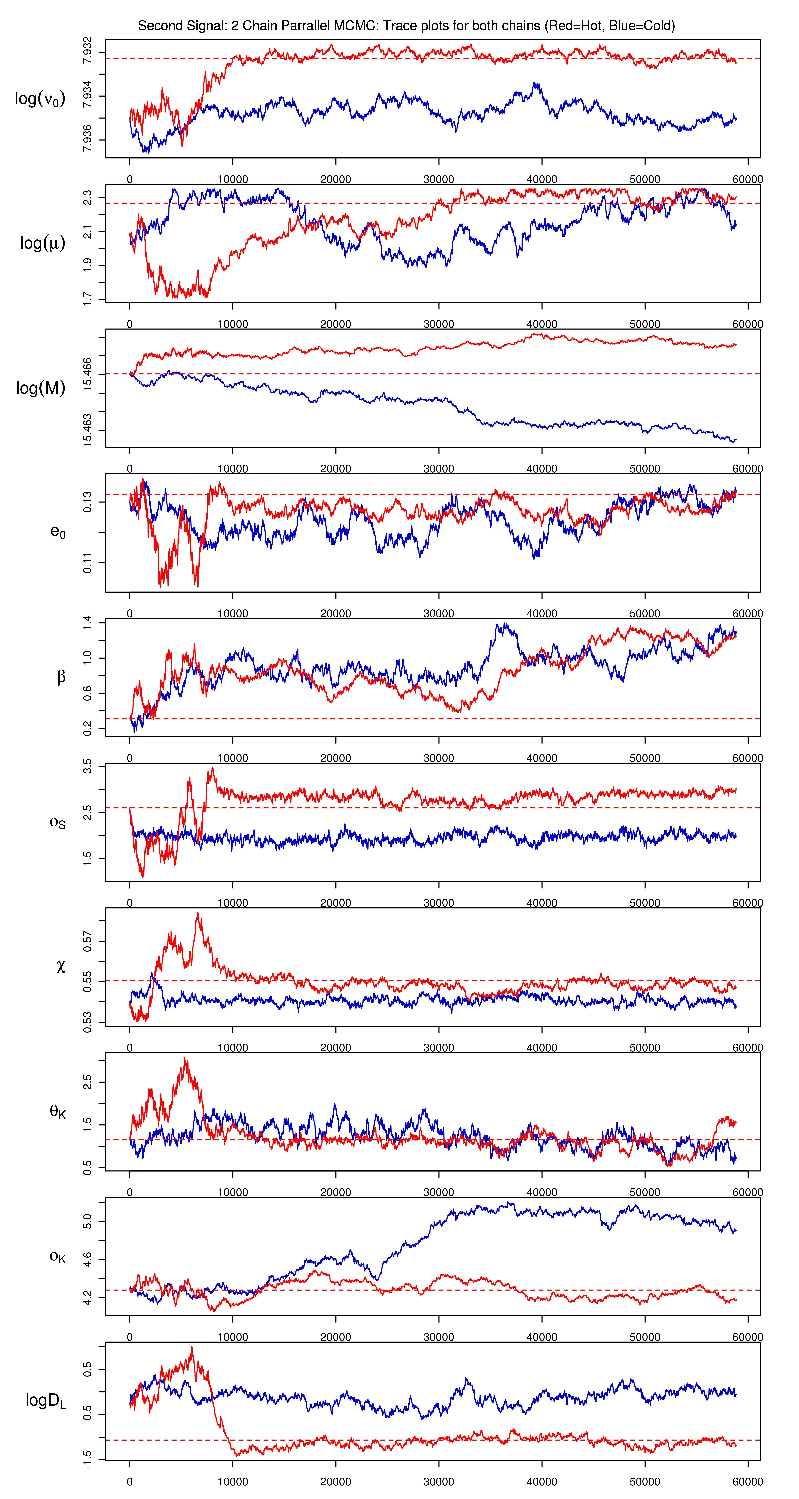
Figure 3. Combind trace plots of both cold (blue) and hot (red) chains. For PDF format click on figure.
Figure 4. Combind plots of SNR of both chains (cold=black, hot=red). For PDF format click on figure.
The above results show that both signals were successfully picked up using hot temperature. Besides this the high SNRs (which are also the SNRs of the true signal when using the true parameters) of the hot chains also confirm the fact that its the true signal. We then enabled swapping so that chains can exchange information with each other. See below.
Updated: First Signal : MPI MCMC Results
A 30 chains PTMCMC was ran with MPI i.e. swapping between neighbouring chains was enabled. The temperature was set in a way so that the highest temperature is the same as was in above setups, that's 4. Although this code is still running but we can see how effectively it has found the true modes. See the figures below. For the second signal a 30 chains MCMC will be run as soon as enough cores becomes available on BeSTGRID.
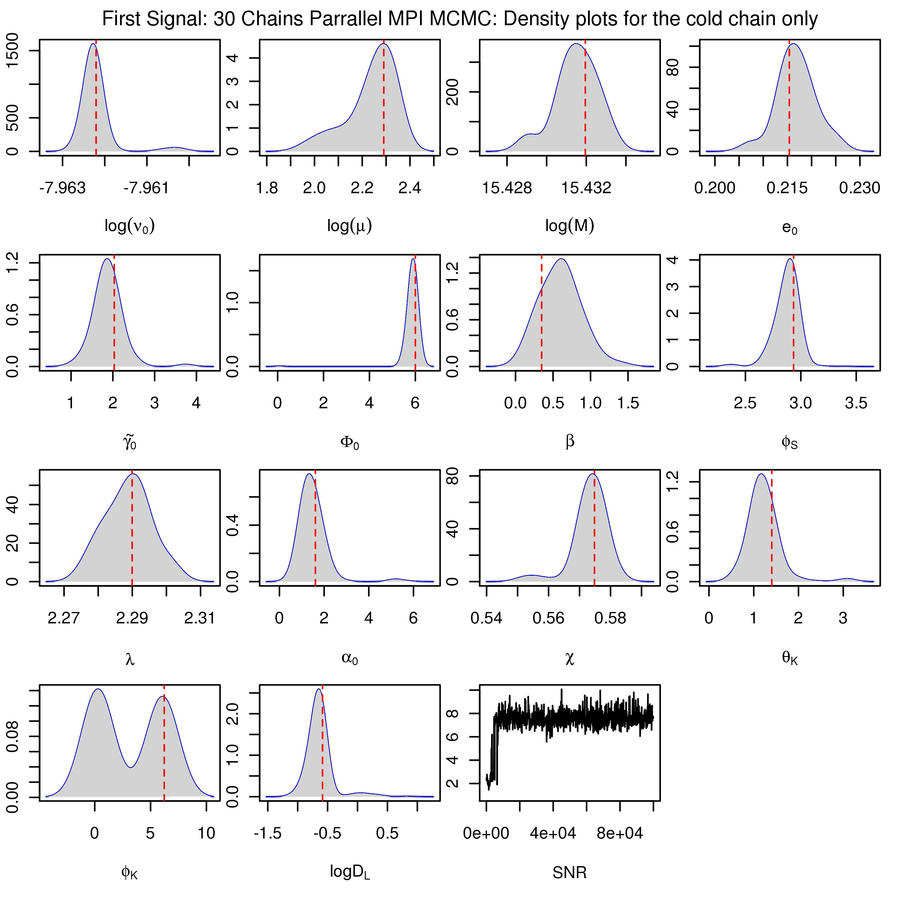
Figure 1. Density plots for BeSTGRID run. For PDF format click on figure.
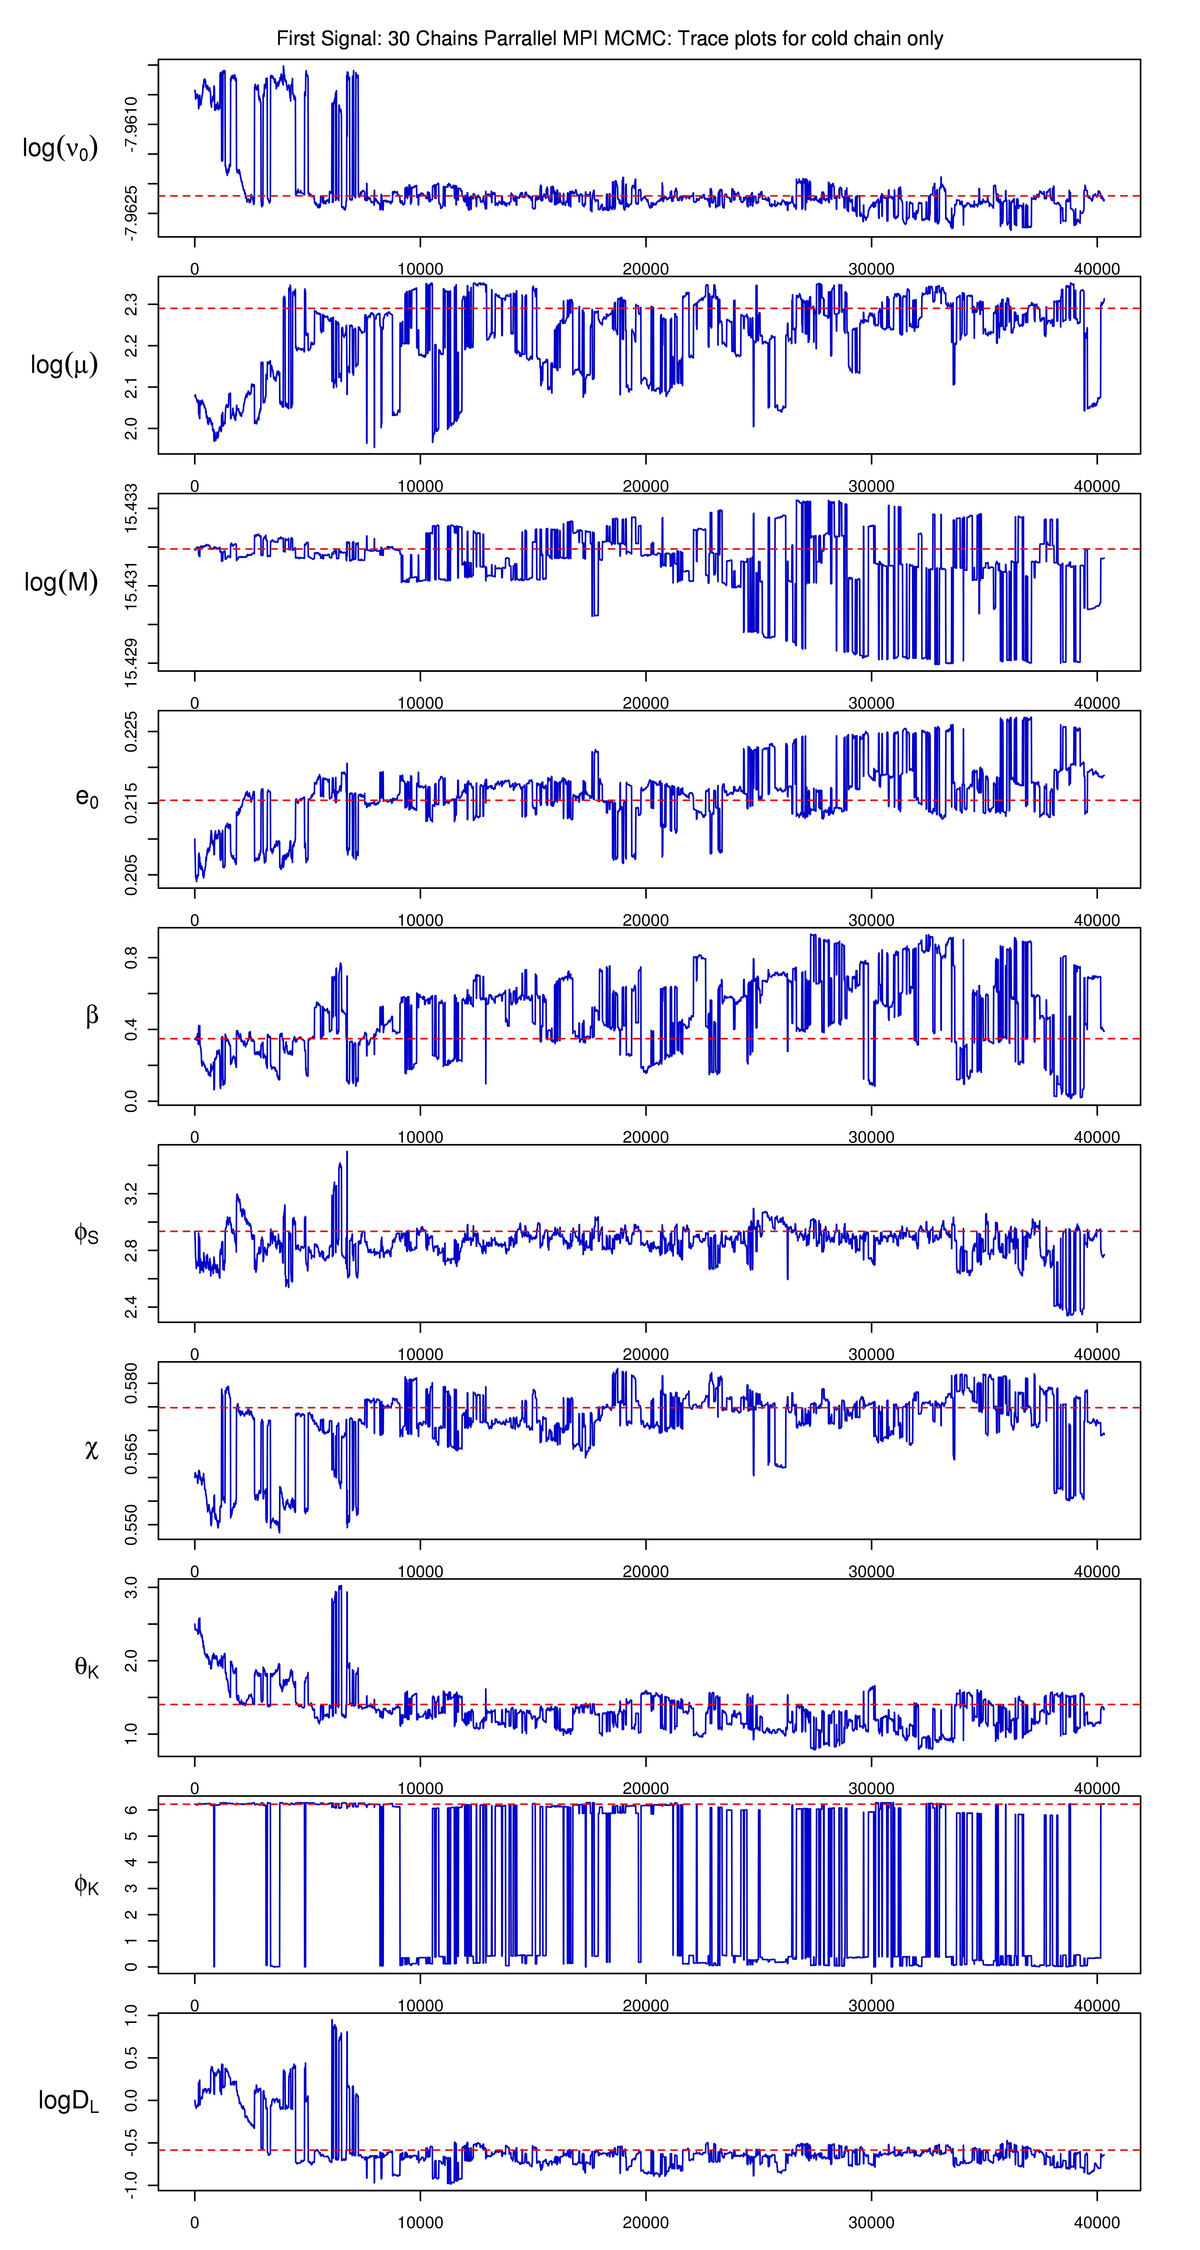
Figure 2. Trace plots for BeSTGRID run. For PDF format click on figure.
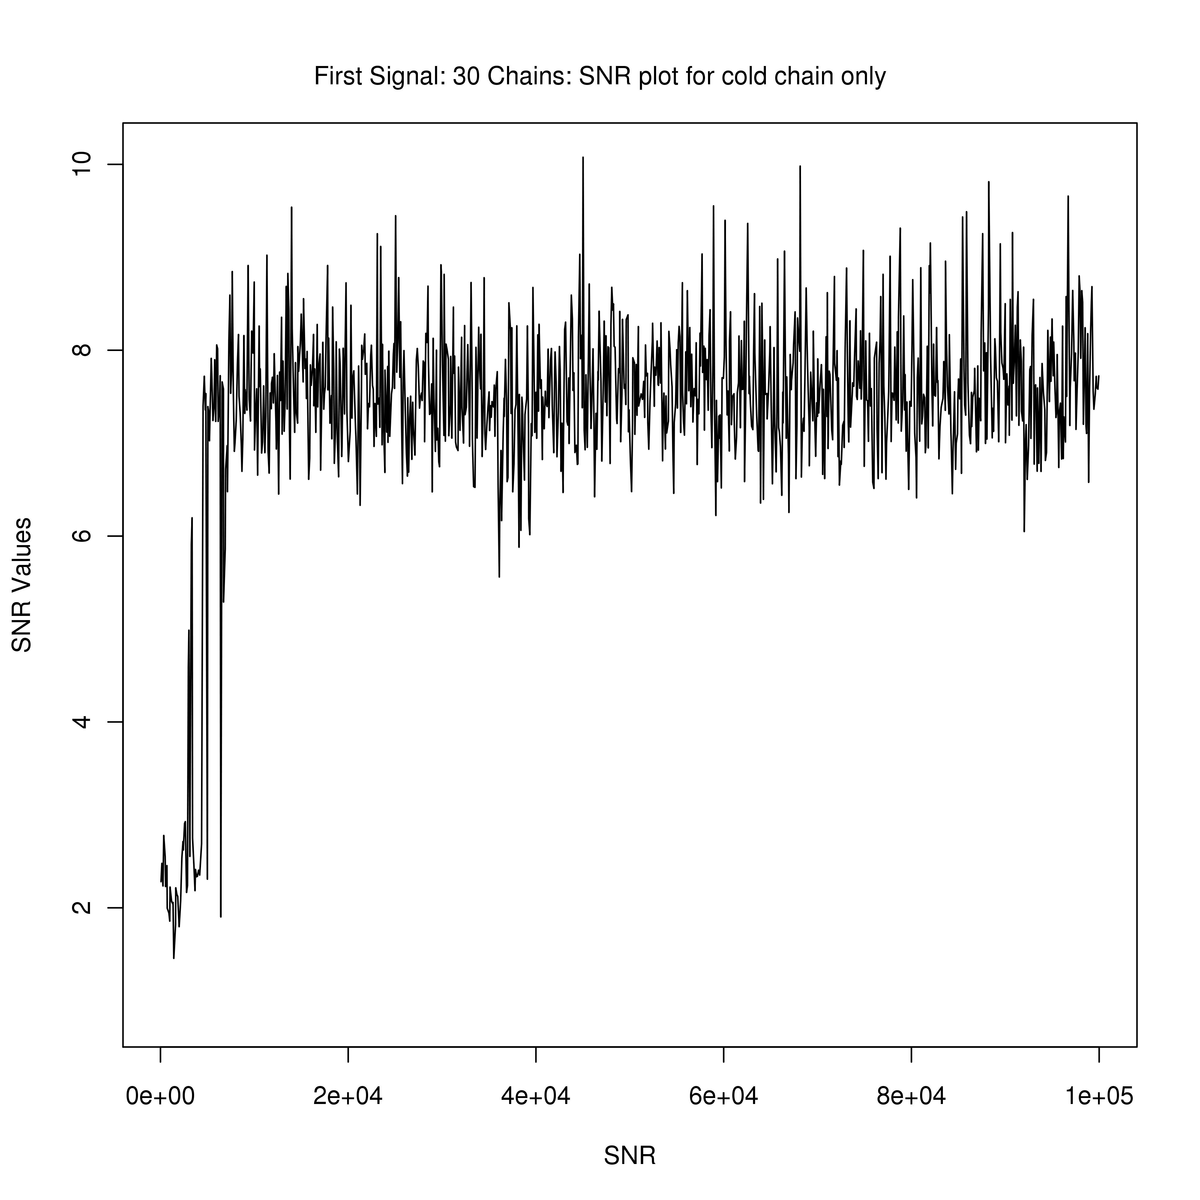
Figure 3. SNR plot for BeSTGRID output. For PDF format click on figure.
Conclusions and Outlook
For the second signal a 30 chains MCMC will be run as soon as enough cores becomes available on BeSTGRID. We can now detect an EMRI signal in a bunch of many signals, another MCMC code is also running on a dataset in which 6 EMRIs signals, generated according to the parameters values of MLDC Round 4 training keys, are mixed up with LISA noise. The results so far are very encouraging as the chains are moving towards the true modes and the SNR is also showing improvements. Although till this time the code is ran only 27,000 iterations but the SNR has started to improve for hot chain (I will post those results tomorrow). From our earlier results its evident that when there is only one signal then our MCMC code finds the true modes within 1500 iterations, but now we can see the current attempts we can see that the sampler took ~10,000 iterations to reach pickup the true parameters. So I think recovering a signal from a more complicated dataset may take more time for the exact recovery of a desired signal.
Full EMRI Results
I have tuned up a proposal distribution for full EMRI model as well. The results are good. I will post some results tomorrow.
6 EMRIs
I have got some results for the 2 chains MCMC run on the 6 EMRIs dataset. Since the second signal in the earlier attempts was from round 4 therefore we tried to pick this signal again. The results are given in the same manner as before. See figures below.
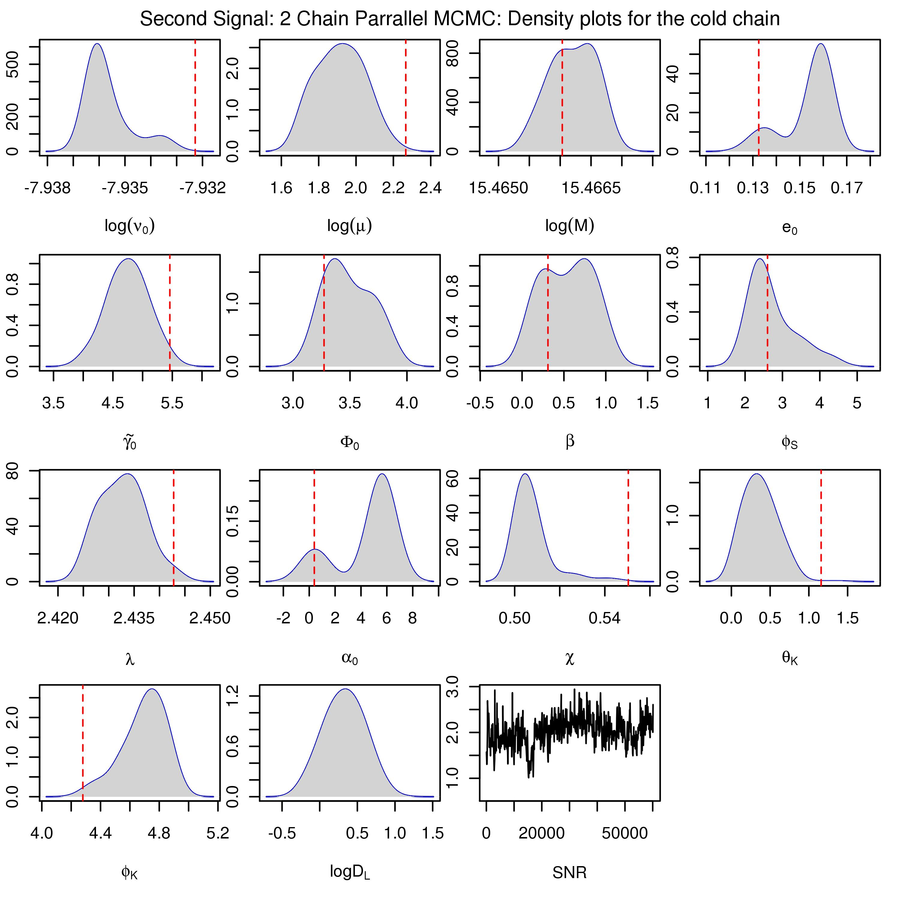
Figure 1. Density plots for the cold chain. For PDF format click on figure.
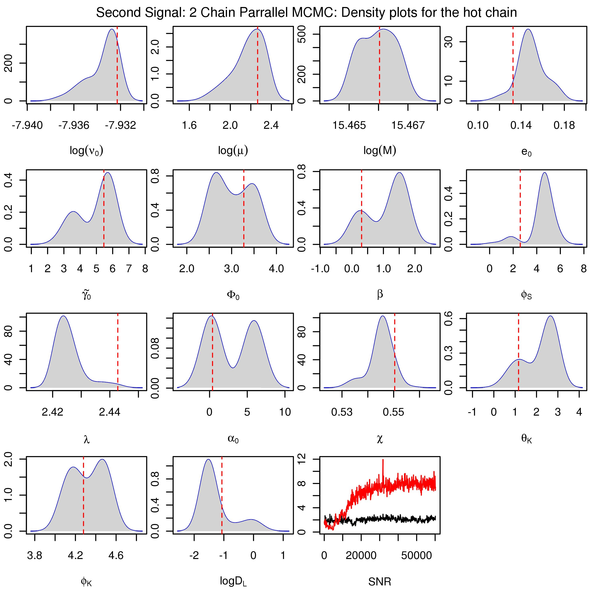
Figure 2. Density plots for the hot chain. For PDF format click on figure.
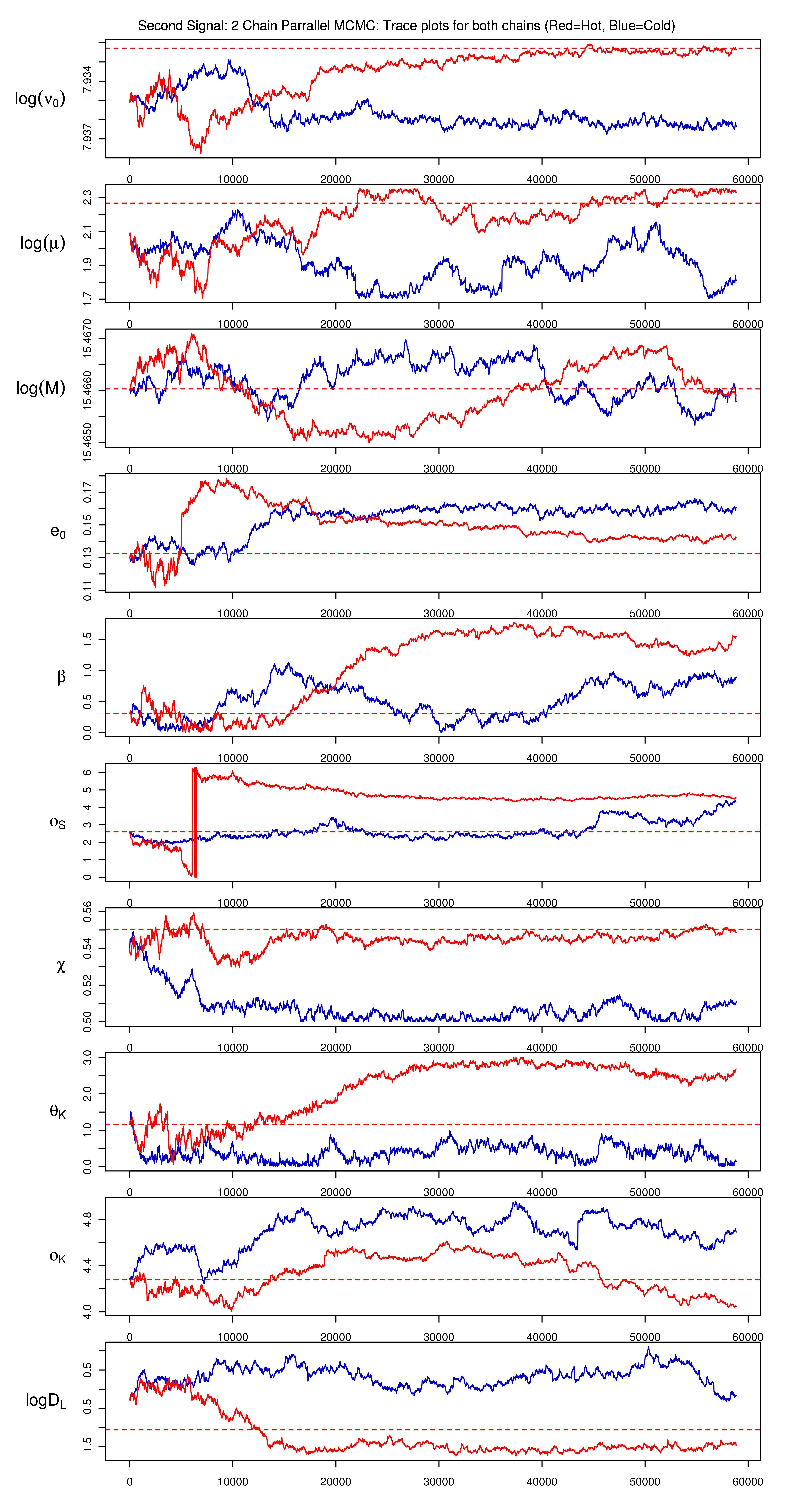
Figure 3. Combind trace plots of both cold (blue) and hot (red) chains. For PDF format click on figure.
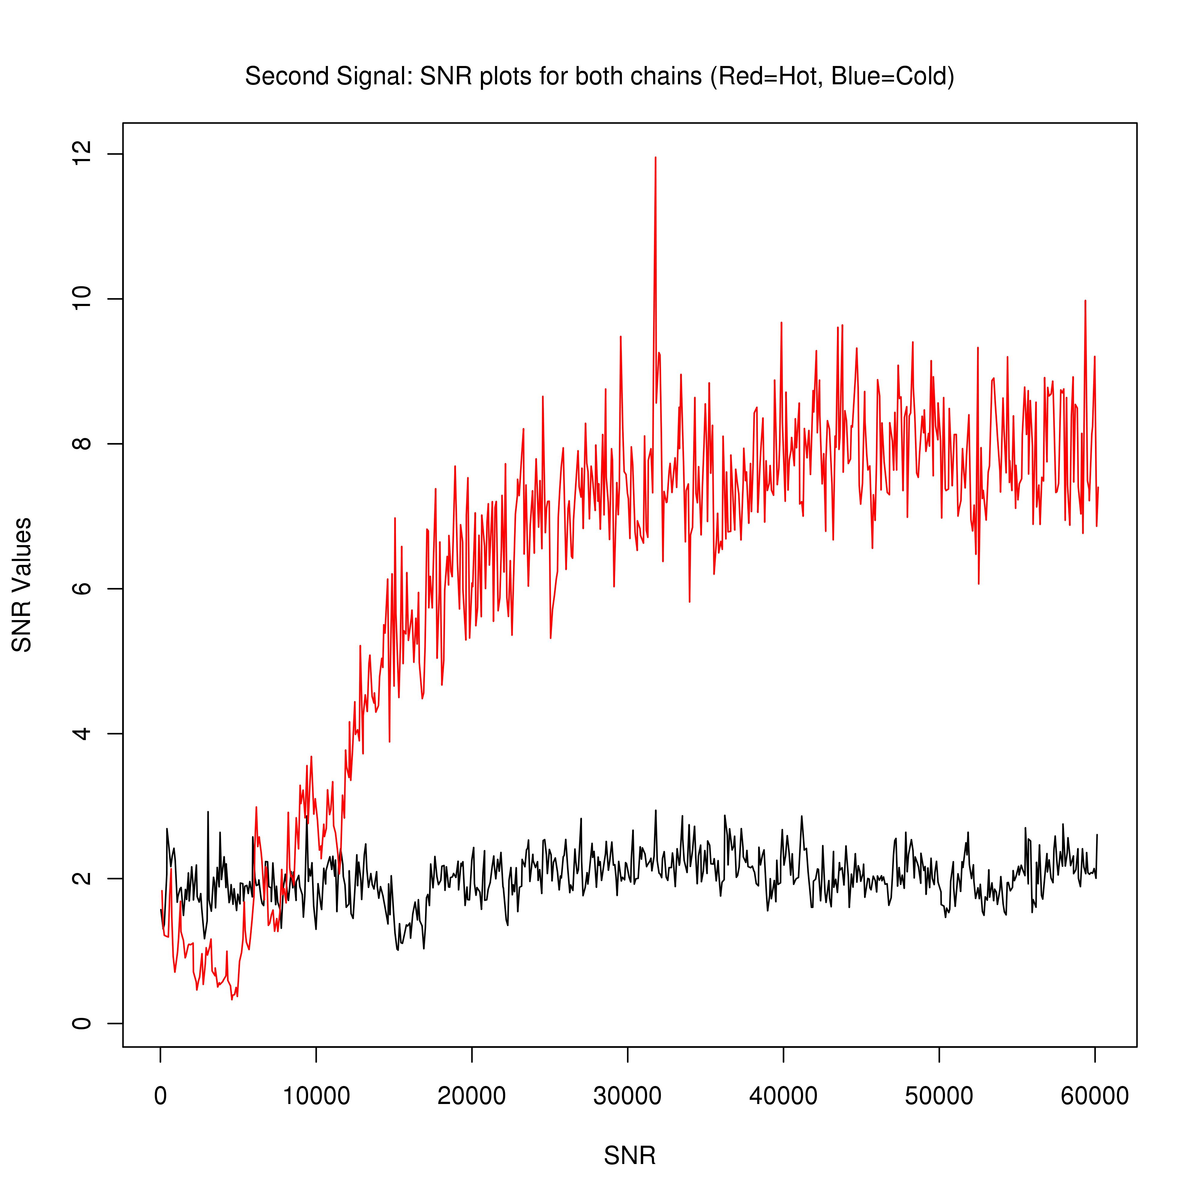
Figure 4. Combind plots of SNR of both chains (cold=black, hot=red). For PDF format click on figure.
Remarks
Besides the parameters' improvements the SNR is giving us some message. Although eccentricity and distance parameters are showing some degeneracy but this can be because of short MCMC run or low temperature (as there are now many signals and the highest temperature level is the same as that of 2 EMRIs) or no swapping. So lets wait untill it is run for 100,000 iterations (till evening or tonight). Note: The results of the first signal are also updated for both Non-MPI and MPI MCMC. While the machine on which the MCMC on second signal was running has been restarted automatically rather mystriously, so I have to restart this code on some other machine.