iNZight FAQ: Graphics and Plotting Issues
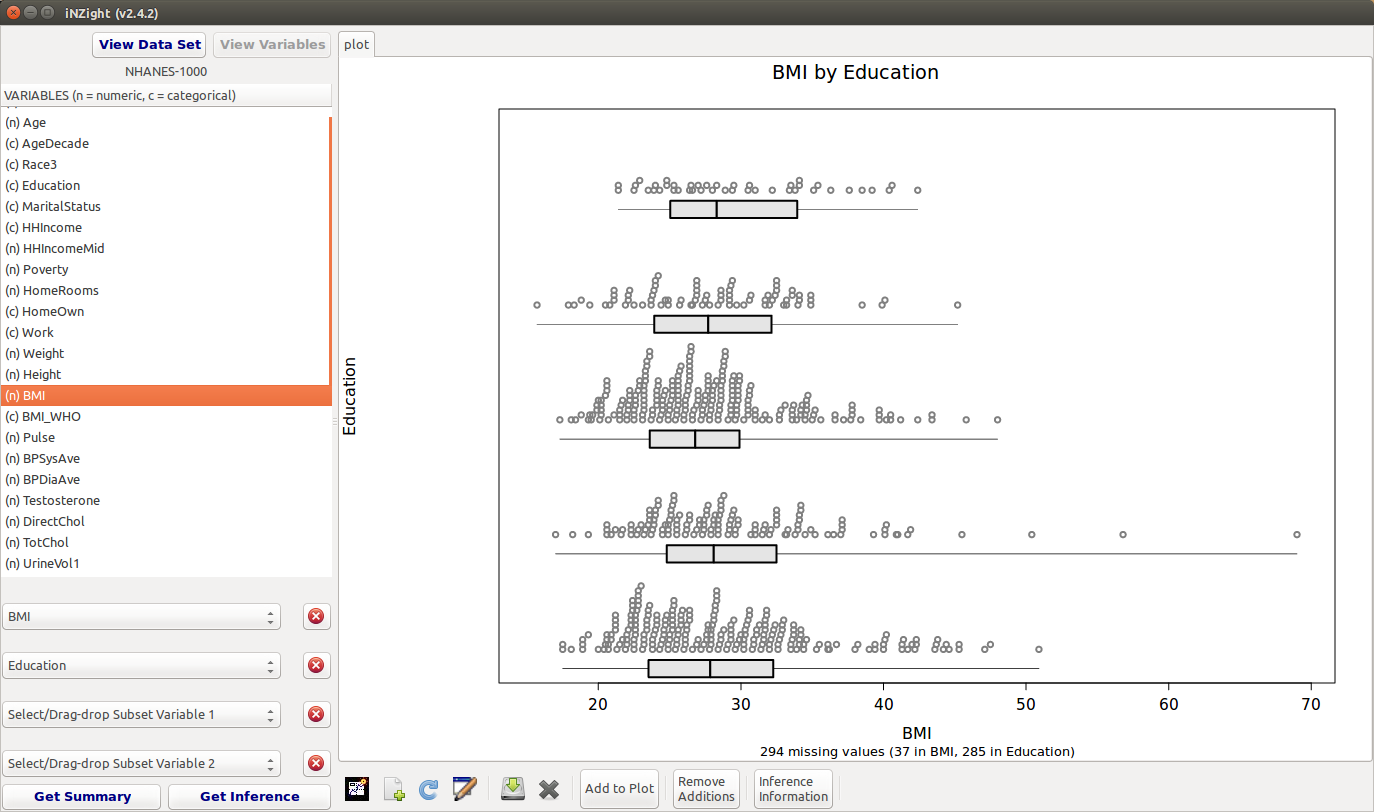
Dotplots and Histograms for groups don't show group labels
On some graphics devices*, the group labels aren't being printed to the screen:
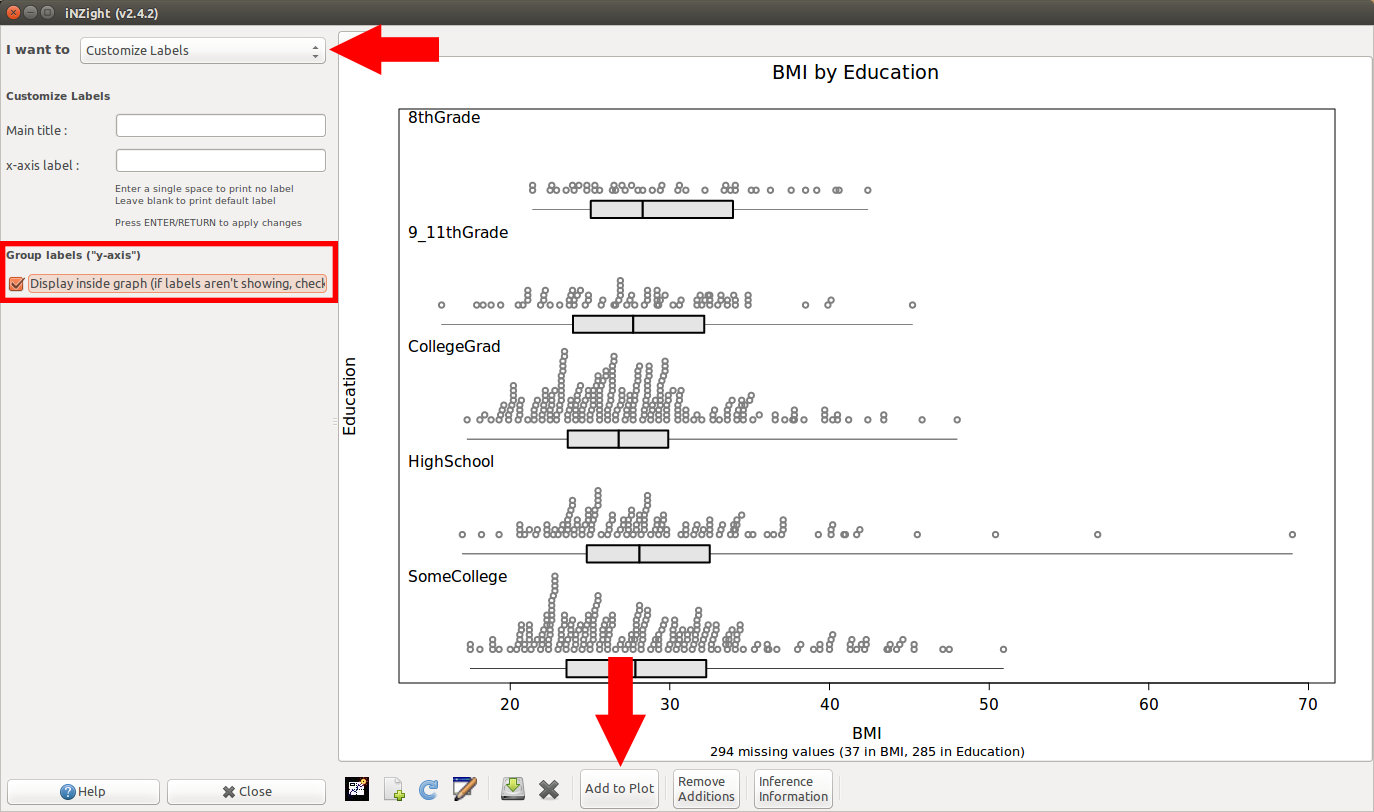
In iNZight version 2.4.2, a workaround was added that allows you to place the group labels inside the plot.
To do this,
- Go to Add to Plot > Customise Labels
- Check the box that says Display inside graph (see image below, left)
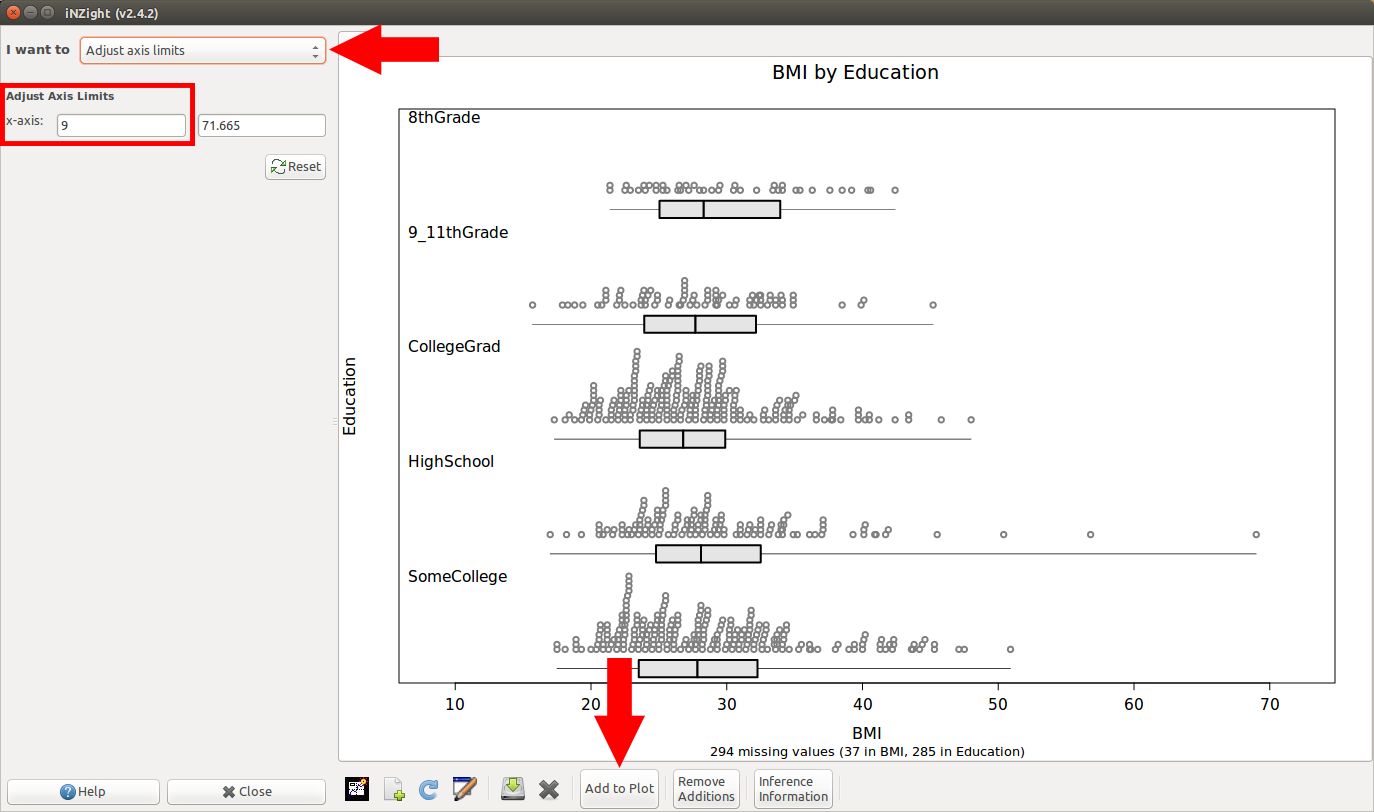
- OPTIONAL: if the labels overlap the points on the graph, you can head to Add to Plot > Adjust axis limits, and reduce the minimum x-axis value (see image below, right)
 (click image to enlarge)
*This issue is known to occur on the following devices:
- RStudio's built-in device
- Cairo Device (used by iNZight) on
- Linux,
- Mac, potentially only if installed manually using R's
install.packagescommand.
Please let us know if you experience it on anything else.
I can't get bar charts to colour by a variable, they just appear one colour (pink)
The problem:
This is most likely due to a bug in the CRAN version of cairoDevice.
It will most likely occur if you have installed iNZight using R's install.packages command.
The bug has been fixed, but is only available from GitHub via
devtools::install_github("lawremi/cairoDevice")This, however, requires several build tools which can be a nuisance to install, so building from GitHub probably isn't a viable solution.
The workaround: The issue only occurs (as far as we are aware) in the built-in graphics device; opening a new device by clicking the "new plot window" button (either from the plot toolbar or the Plot menu) should display the bars in all their glorious colours.
I'm not getting complete plots
This issue was fixed with iNZightVIT v2.0.3. Running the __UPDATE_iNZightVIT__ file should fix the issue.
If not:
-
Go to File > Home. This will take you back to the iNZightVIT start-up window
- Click Start iNZight and iNZight will load up instantly
This works like a "Reset", but is much faster than crashing out and restarting from scratch
The text and/or points in the VIT modules are too large/unreadable
This problem has mostly been encountered on Retina MacBook Pros, and is caused by the high resolution of the screen. This appears to have been a bug in a previous version of XQuartz, and updating this seems to fix the problem. Download the latest version here.
If the above doesn't work, you can use the Preferences to adjust the scaling:
-
Click FILE > Preferences ...
-
Adjust the sliders to modify the values (we suggest
ps = 7anddpi = 220for retina Macbook Pros) -
Click OK. A new graphics windows will open up (you can close the old one if it doesn't automatically).
- Repeat the process if you want to try out different values.
These values will be saved for future sessions. If you have trouble saving (a message will inform you) please contact inzight_support@stat.auckland.ac.nz for assistance.
I can't copy or save dot plots
We currently have an export problem with dot plots (but not any other type of graph). It is being caused by double plotting to figure out the sizes and positions of the dots for stacking. We still haven't figured out a solution. Until we do you'll just have to use screenshots. Sorry ...