Dataset ("Row") Operations

Filter Dataset
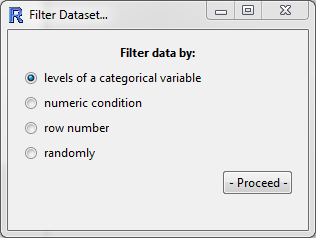
This tool provides several methods for filtering the dataset. The window that opens has four options for you to choose from:
-
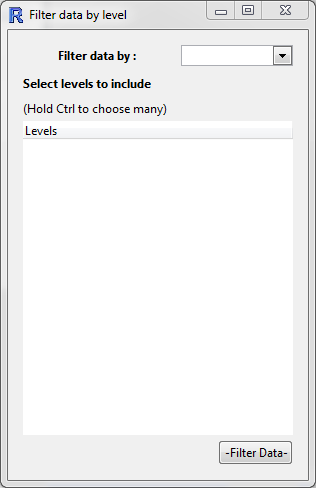
Levels of a categorical variables
After selecting a categorical variable from the drop down box, you can select which levels you want to retain in the data set.
-
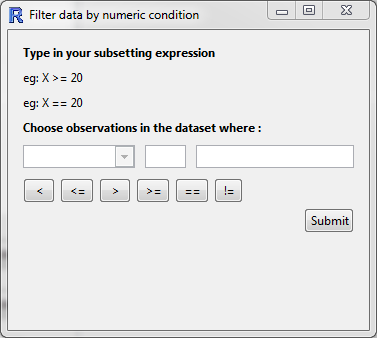
Numeric condition
This allows you to define a condition with which to filter your data.
For example, you could include only the observations of
heightover 180 cm by- selecting
heightfrom the drop down menu, - clicking on the
>symbol, and - entering the value
180in the third box.
- selecting
-
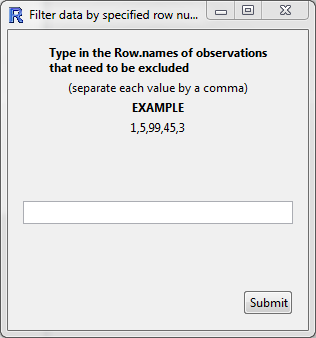
Row number
Exclude a range of row numbers as follows:
- Entering 101:1000 (and then Submit) will exclude all rows from 101 to 1000
- Similarly, 1, 5, 99, 101:1000 will exclude rows 1, 5, 99, and everything from 101 to 1000
-
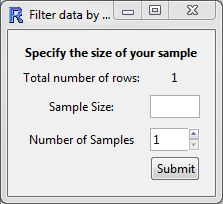
Randomly
Essentially, this allows you to perform bootstrap randomisation manually.
The current behaviour is this:
- "Sample Size", n, is the number of observations to draw for each sample,
- "Number of Samples", m, is the number of samples to create in the new data set.
- The output will be a data set with n x m rows, which must be smaller than the total number of rows in the data set.
- The observations are drawn randomly without replacement from the data set.
Sort data by variables
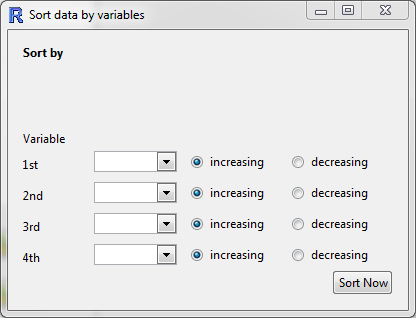
Sort the rows of the data by one or more variables. The ordering will be nested, so that the data is first ordered by "Variable 1", and then "Variable 2", etc. For categorical variables, the ordering will be based on the order of the variable (by default, this will be alphabetical unless manually changed in "Manipulate Variables" > "Categorical Variables" > "Reorder Levels").
Aggregate data
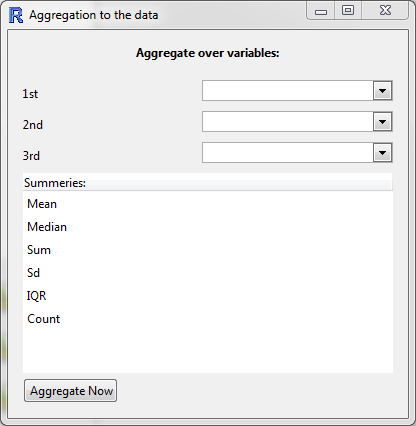
This function essentially allows you to obtain "summaries" of all of the numeric variables in the data set for combinations of categorical variables.
-
Variables: if only one variable is specified, the new data set will have one row for each level of the variable.
If two (or more) are specified, then there will be one row for each combination. For example, the categorical variables
gender = {male, female}andethnicity = {white, black, asian, other}will result in a data set with 2x4 rows. -
Summaries: each row will have the chosen summaries given for each numeric variable in the data set.
For example, if the data set has the variables
gender (cat)andheight (num), and if the user selectsMeanandSd, then the new data set will have the columnsgender,height.Meanandheight.Sd. In the rows, the values will be for that combination of categorical variables; the row forgender = femalewill have the mean height of the females, and the standard deviation of height for the females.
A visual example of this would be do drag height into the Variable 1 slot, and gender into the Variable 2 slot.
Clicking on "Get Summary" would provide the same information. The advantage of using Aggregate is that the summaries are calculated for every numeric variable in the data set, not just one of them.
Stack variables
Convert from table form (rows corresponding to subjects) to long form (rows corresponding to observations).
In many cases, the data may be in tabular form, in which multiple observations are made but placed in different columns.
An example of this may be a study of blood pressure on patients using several medications. The columns of this data set may be:
patient.id, gender, drug, Week1, Week2, Week3. Here, each patient has their own row in the data set, but each row contains three observations of blood pressure.
| patient.id | gender | drug | Week1 | Week2 | Week 3 |
|---|---|---|---|---|---|
| 1 | male | A | 130 | 125 | 120 |
| 2 | male | B | 140 | 130 | 110 |
| 3 | female | A | 120 | 119 | 116 |
We may want to convert to long form, where we have each observation in a new row, and use a categorical variable to differentiate the weeks.
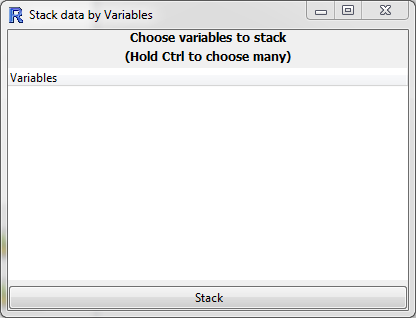
In this case, we would select Week1, Week2, and Week3 as the variables in the list. The new data set will have the columns
patient.id, gender, drug, Stack.variable ("Week"), and stack.value ("blood pressure").
| patient.id | gender | drug | stack.variable | stack.value |
|---|---|---|---|---|
| 1 | male | A | Week1 | 130 |
| 1 | male | A | Week2 | 125 |
| 1 | male | A | Week3 | 120 |
| 2 | male | B | Week1 | 140 |
| 2 | male | B | Week2 | 130 |
| 2 | male | B | Week3 | 110 |
| 3 | female | A | Week1 | 120 |
| 3 | female | A | Week2 | 119 |
| 3 | female | A | Week3 | 116 |
Of course, you can rename the variables as appropriate using "Manipulate Variables" > "Rename Variables".
Restore Dataset
Restores the data set to the way it was when it was initially imported.

