Add Inference Information
iNZight provides users with an easy interface for adding inference information to plots, using "normal theory" or bootstrap methods. The inference options available again depend on the type of plot drawn.
Scatter Plot Inference
If a scatter plot is drawn, you must first add trend lines before you can obtain inference information. This is done using the Add to Plot button, selecting Add trend line and selecting one or more trends (this includes the smoother).
Having added a trend line or lines, the inference information will generate 30 bootstrap trend lines and display these on the graph, giving users an idea of the precision of the estimated curve.
Dot Plot Inference
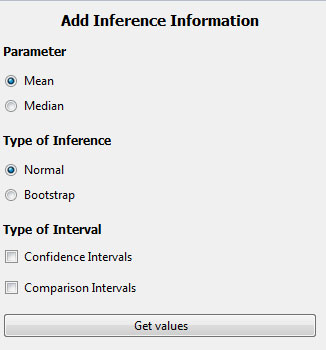
Dot plots, by default, provide a box plot which provides an estimate of the Median, as well as the 25% and 75% quantiles. Users are then presented with three options:
-
Parameter: the parameter for which inference is obtained
-
Mean: this will generate inference of the mean of the data
- Median: this will generate inference of the median of the data
-
-
Type of Inference: Depending on the parameter, users can select the type of inference used to obtain the intervals displayed on the graph
-
Normal: this uses standard normal theory to approximate a confidence interval
-
Year 12: for medians, the year 12 (NCEA L3) method of computing an interval is used
- Bootstrap: this method uses bootstrap sampling to obtain confidence or comparison intervals of the chosen parameter
-
-
Type of Interval: the type of interval displayed
-
Confidence Interval: this displays a 95% confidence interval
- Comparison Interval: if a numeric and categorical variable have been plotted, comparison intervals can be added to allow visual comparison of the mean or median of the numeric variable between different levels of the categorical variable.
-
Bar Plot Inference
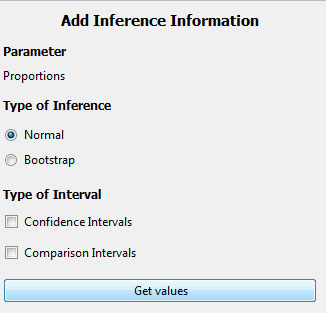
The inference information for bar plots is computed for the estimated proportions, using normal theory or bootstrap techniques.